Percentage of Homeownership by Decade and by State

Percentage of Homeownership by Decade and by State | MyKCM

There has been a lot of talk about the falling homeownership rate in the United States. In December 2004, the homeownership rate reached an all-time high of 69.4%, while the current rate is 62.9%. When comparing these two figures, there is some room for concern regarding the difference.

However, today we want to shine some light on the issue by:

  1. Showing what historic homeownership rates have looked like over the last 130 years.
  2. Breaking down the current percentages by state.

Historic Homeownership Rates:

Percentage of Homeownership by Decade and by State | MyKCM

Current Homeownership Rates by State:

Percentage of Homeownership by Decade and by State | MyKCM

All of the states that you see in blue on the map above have a greater homeownership rate than the national average.

Bottom Line

Though the homeownership rate has fallen recently, the percentage is still at a healthy rate compared to historic numbers, and most states currently have a higher percentage than the national average.

Sales of Distressed Properties Hit New Low

The National Association of Realtors (NAR) recently released their latest Existing Home Sales Report revealing that distressed property sales accounted for 4% of sales in September. This is down from 7% in 2015, and is the lowest figure since NAR began tracking distressed sales in October 2008.

Below is a graph that shows just how far the market has come since January 2012 when distressed sales accounted for 35% of all sales.

Sales of Distressed Properties Hit New Low | MyKCM

Existing Home Sales Hit 2nd Highest Figure Since June 

Mortgage interest rates remained well below 4% in September at 3.46%, prompting existing home sales to stay at a healthy annual pace of 5.47 million. Month-over-month sales were up 3.2%.

Inventory of homes for sale remains below the 6-month supply that is necessary for a normal market, as it fell 2.2% to a 4.5-month supply. The shortage in inventory has contributed to the median home price rising an additional 5.6% to $234,200.

NAR’s Chief Economist, Lawrence Yun had this to say about the lack of inventory:

“Inventory has been extremely tight all year and is unlikely to improve now that the seasonal decline in listings is about to kick in.”

There is good news though, as Yun went on to say:

“There’s hope the leap in sales to first-time buyers can stick through the rest of the year and into next spring. The market fundamentals — primarily consistent job gains and affordable mortgage rates — are there for the steady rise in first-timers needed to finally reverse the decline in the homeownership rate.”  

Bottom Line

If you are debating putting your home on the market this year, now may be the time. Buyers are still out there looking for their dream home. Let’s get together to determine your best plan.

7 Graphs That Show the Real Estate Market Is Back!

7 Graphs That Show the Real Estate Market is Back! [INFOGRAPHIC] | MyKCM

Some Highlights:

  • Distressed property sales fell to its lowest number since NAR began tracking it in 2008.
  • As you can see, with less distressed properties, sales are up in all price ranges except the $0 – $100K price range.
  • Interest rates are still at historic lows, signifying that now is the right time to buy!

The ‘Great News’ About Rising Prices

The ‘Great News’ About Rising Prices | MyKCM

Recently there has been a lot of talk about home prices and if they are accelerating too quickly. In some areas of the country, seller supply (homes for sale) cannot keep up with the number of buyers out looking for a home, which has caused prices to rise.

The great news about rising prices, however, is that according to CoreLogic’s latest US Economic Outlook, the average American household gained over $11,000 in equity over the course of the last year, largely due to home value increases.

The map below was created from CoreLogic’s report and shows the average equity gain per mortgaged home from June 2015 to June 2016 (the latest data available).

The ‘Great News’ About Rising Prices | MyKCM

For those that are worried that we are doomed to repeat 2006 all over again, it is important to note that homeowners are investing their new found equity in their homes and themselves, not in depreciating assets.

The added equity is helping families put their children through college, and even invest in starting small businesses, allowing them to pay off their mortgage sooner or move up to the home that will better suit their needs now.

Bottom Line

CoreLogic predicts that home prices will appreciate by another 5% by this time next year. If you are a homeowner looking to take advantage of your home equity by moving up to your dream home, let’s get together to discuss your options!

Appraisers & Homeowners Don’t See Eye-To-Eye on Values


In today’s housing market, where supply is very low and demand is very high, home values are increasing rapidly. Many experts are projecting that home values could appreciate by another 5%+ over the next twelve months. One major challenge in such a market is the bank appraisal.

If prices are surging, it is difficult for appraisers to find adequate, comparable sales (similar houses in the neighborhood that closed recently) to defend the selling price when performing the appraisal for the bank.

Every month, Quicken Loans measures the disparity between what a homeowner believes their house is worth as compared to an appraiser’s evaluation in their Home Price Perception Index (HPPI). Here is a chart showing that difference for each of the last 12 months.

Appraisers & Homeowners Don’t See Eye-To-Eye on Values | Simplifying The Market

Bottom Line

Every house on the market has to be sold twice; once to a prospective buyer and then to the bank (through the bank’s appraisal). With escalating prices, the second sale might be even more difficult than the first. If you are planning on entering the housing market this year, let’s get together to discuss this, and any other obstacle that may arise.

The Past, Present & Future of Home Prices


CoreLogic released their most current Home Price Index last week. In the report, they revealed home appreciation in three categories: percentage appreciation over the last year, over the last month and projected over the next twelve months.Here are state maps for each category: 

The Past – home appreciation over the last 12 months

The Past, Present & Future of Home Prices | Simplifying The Market

The Present – home appreciation over the last month

The Past, Present & Future of Home Prices | Simplifying The Market

The Future – home appreciation projected over the next 12 months

The Past, Present & Future of Home Prices | Simplifying The Market

Bottom Line

Homes across the country are appreciating at different rates. If you plan on relocating to another state and are waiting for your home to appreciate more, you need to know that the home you will buy in another state may be appreciating even faster.

Why We Need More Newly Constructed Homes


The number of new home sales is far off historic norms. The National Association of Realtors (NAR) just reported that the percentage of all house sales that were newly constructed homes has fallen to the lowest numbers in forty years. Here is a graph showing the percentages:

Why We Need More Newly Constructed Homes | Simplifying The Market

This should come as no surprise as the number of new housing starts has fallen dramatically over the last several years:

Why We Need More Newly Constructed Homes | Simplifying The Market

Bottom Line

We need more new construction for two reasons:

  1. It will relieve some of the pent-up buying demand that is causing price appreciation to continue to increase well above historic norms.
  2. It will give better opportunities to many current homeowners who want to sell but can’t find an adequate home to move in to.

5 Stats That Prove the Real Estate Market Is Getting Stronger

Whenever there is talk about an improving housing market, some begin to show concern that we may be headed toward another housing bubble that will be followed by a crash similar to the one we saw last decade.

Here are five data points that show the housing market will continue to recover, and that a new housing crisis is not about to take shape.

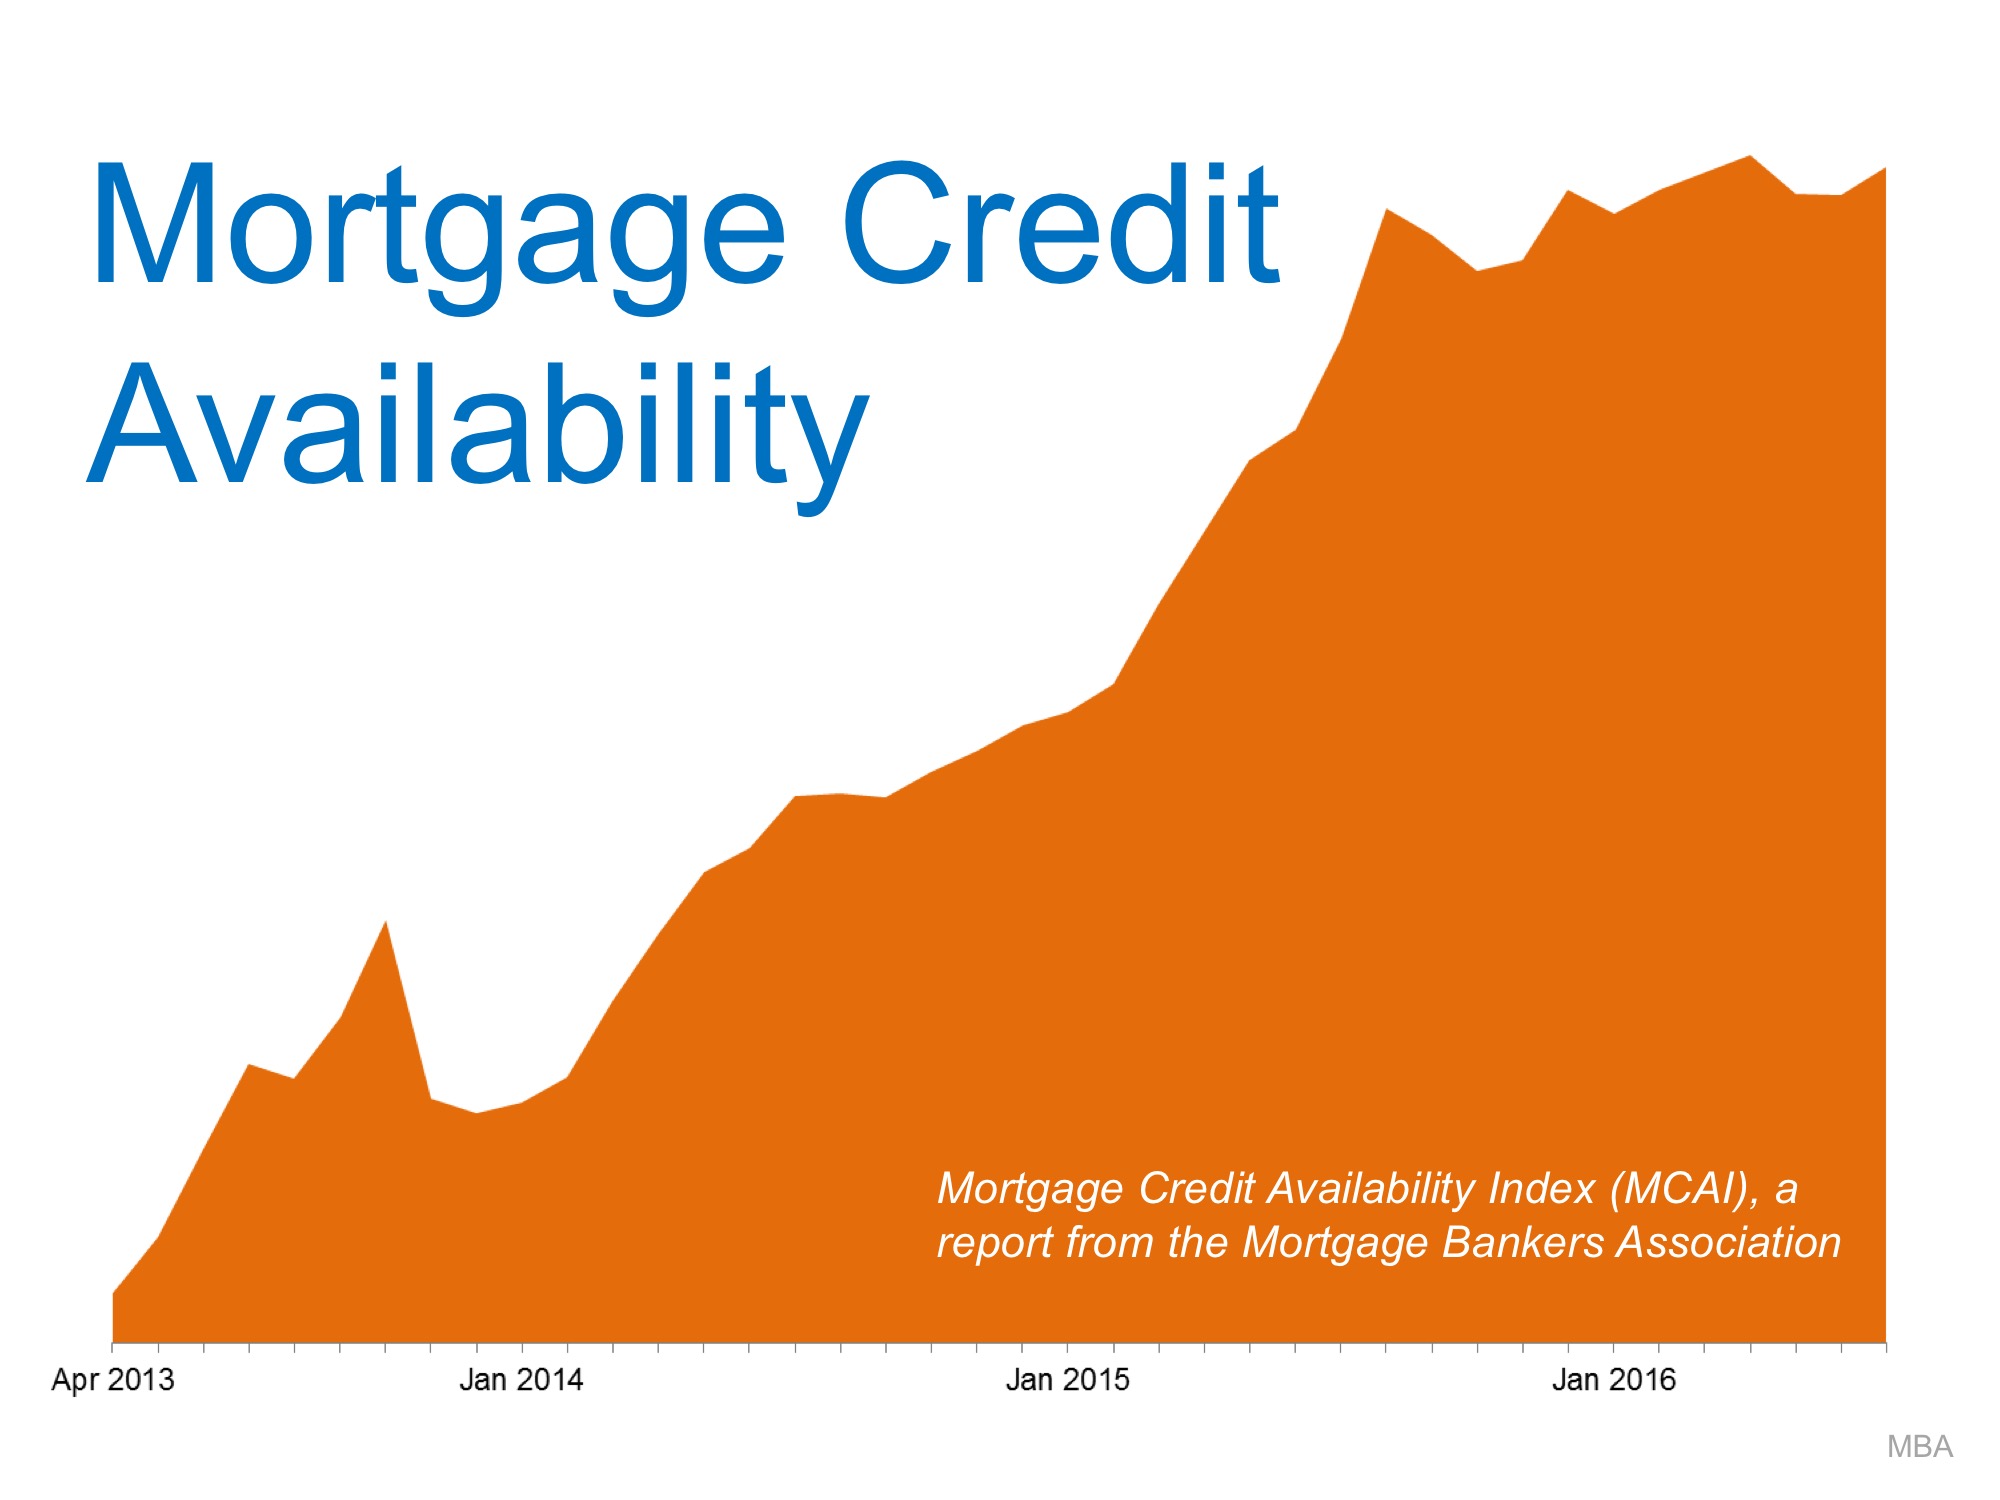
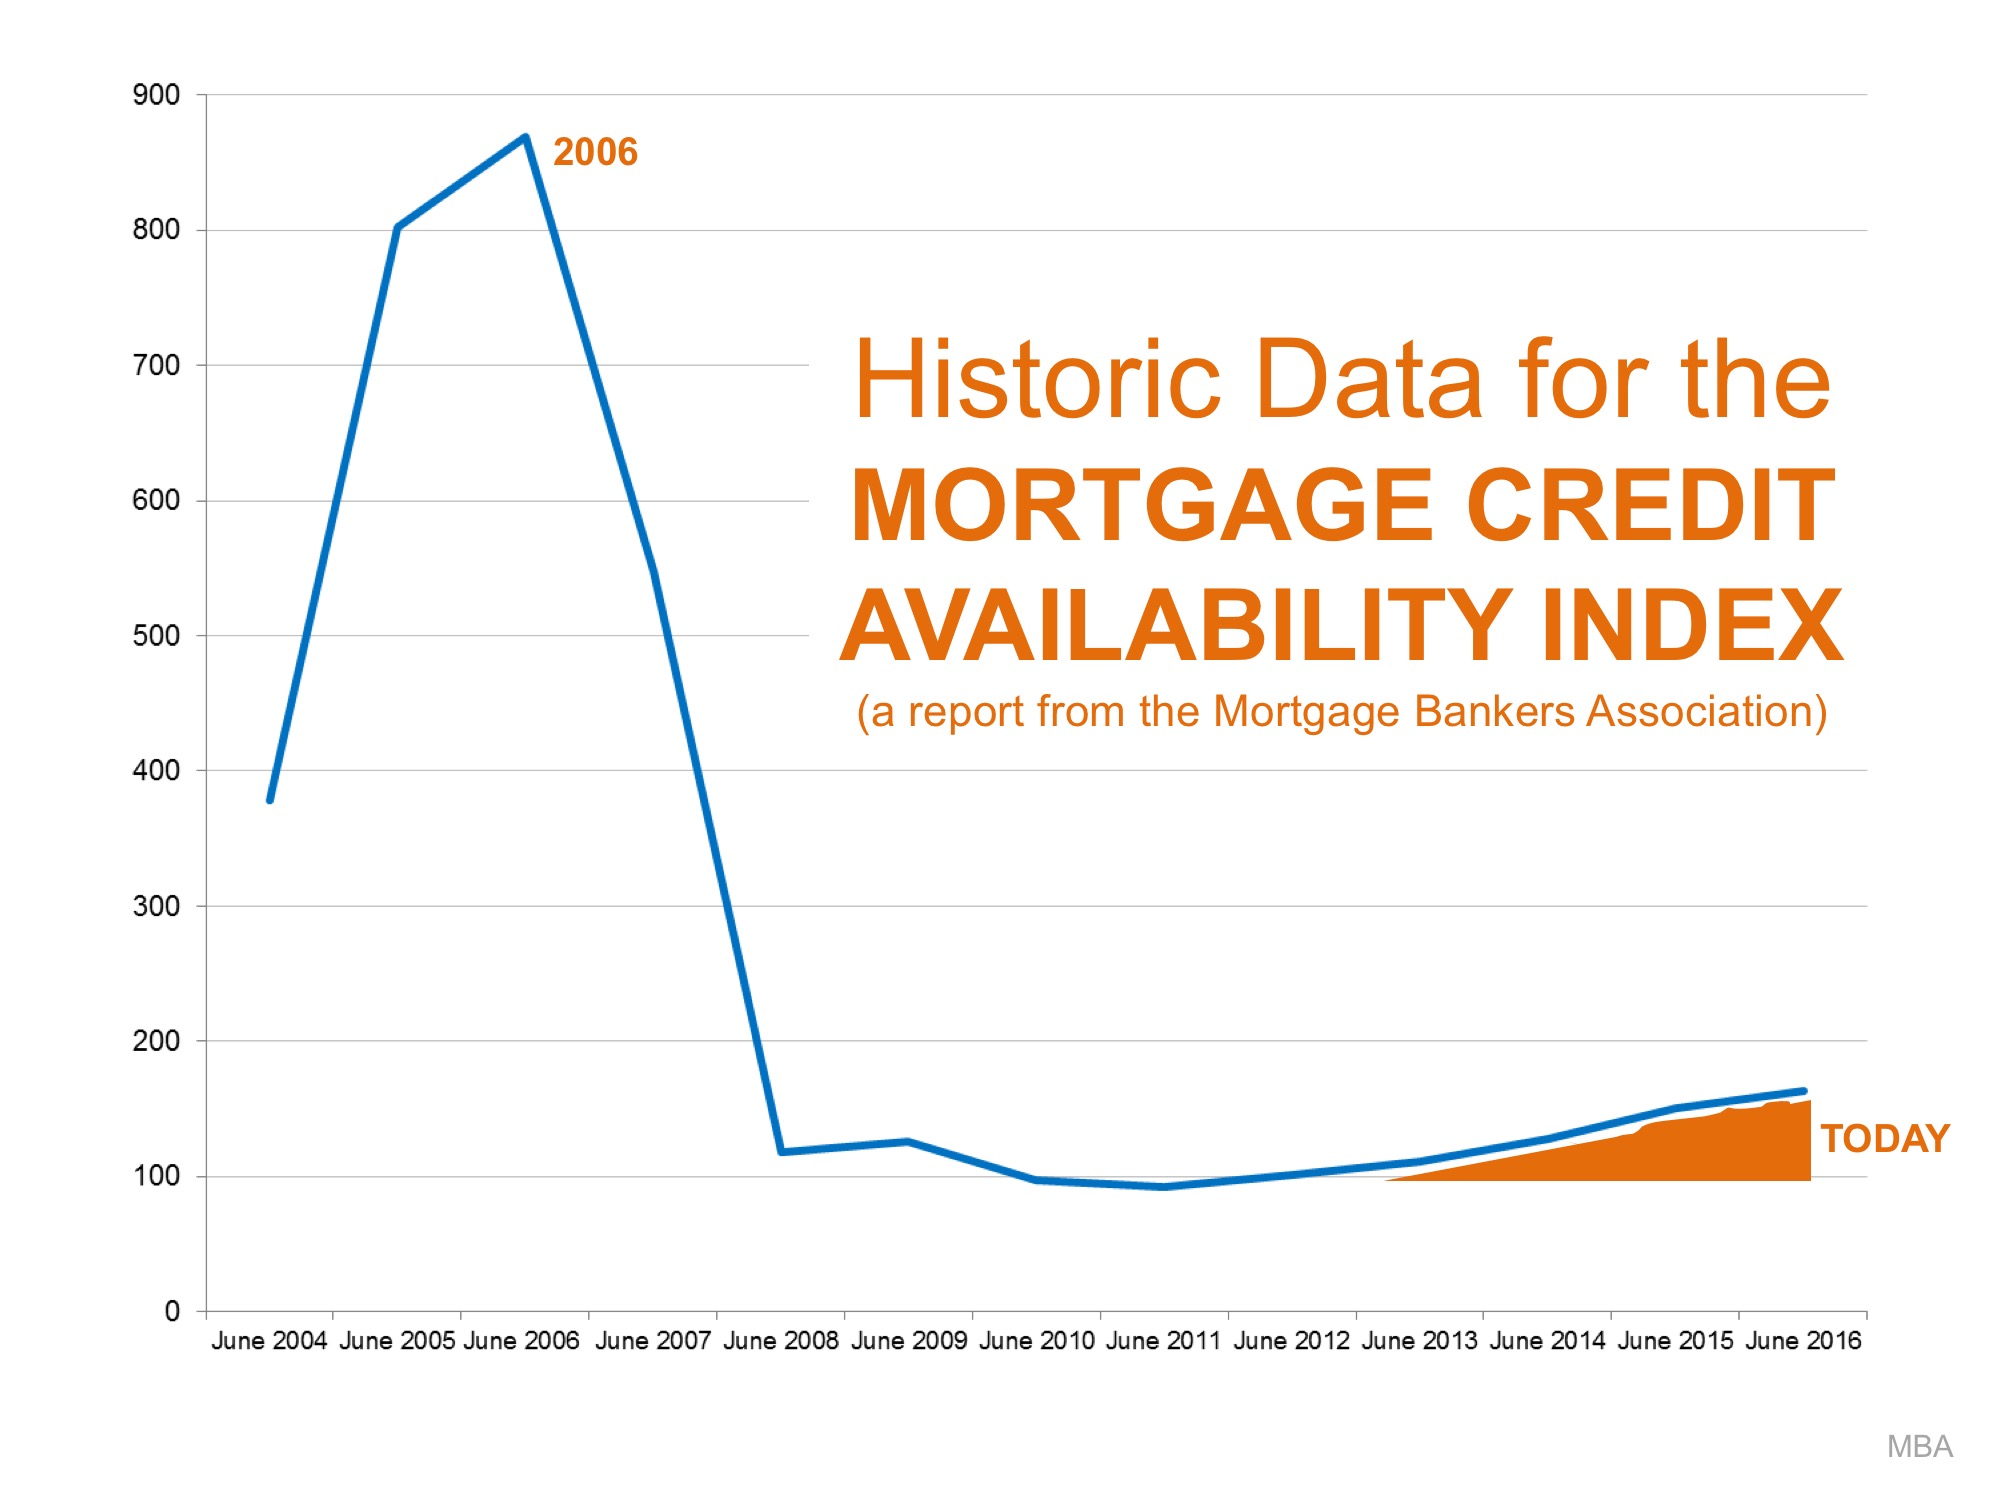
1) Mortgage availability is increasing, but is nowhere near the levels we saw in 2004-2006.

A buyer’s chances of being approved for a mortgage have increased over the last three years; That’s good news for the market. This is not a precursor to another challenge, as many experts maintain that it is still too difficult for many buyers to attain house financing.

As Jonathan Smoke, the Chief Economist of realtor.com, recently explained:

“The havoc during the last cycle was the result…of speculation fueled by loose credit. That’s the exact opposite of what we have today.”

2) The Housing Affordability Index, which measures whether or not a typical family earns enough income to qualify for a mortgage loan on a typical home, based on the most recent price and income data. The current index shows that it is more affordable to buy a home today than at any other time between 1990 and 2008. With median incomes finally beginning to rise, houses should continue to remain affordable and housing demand should remain strong.

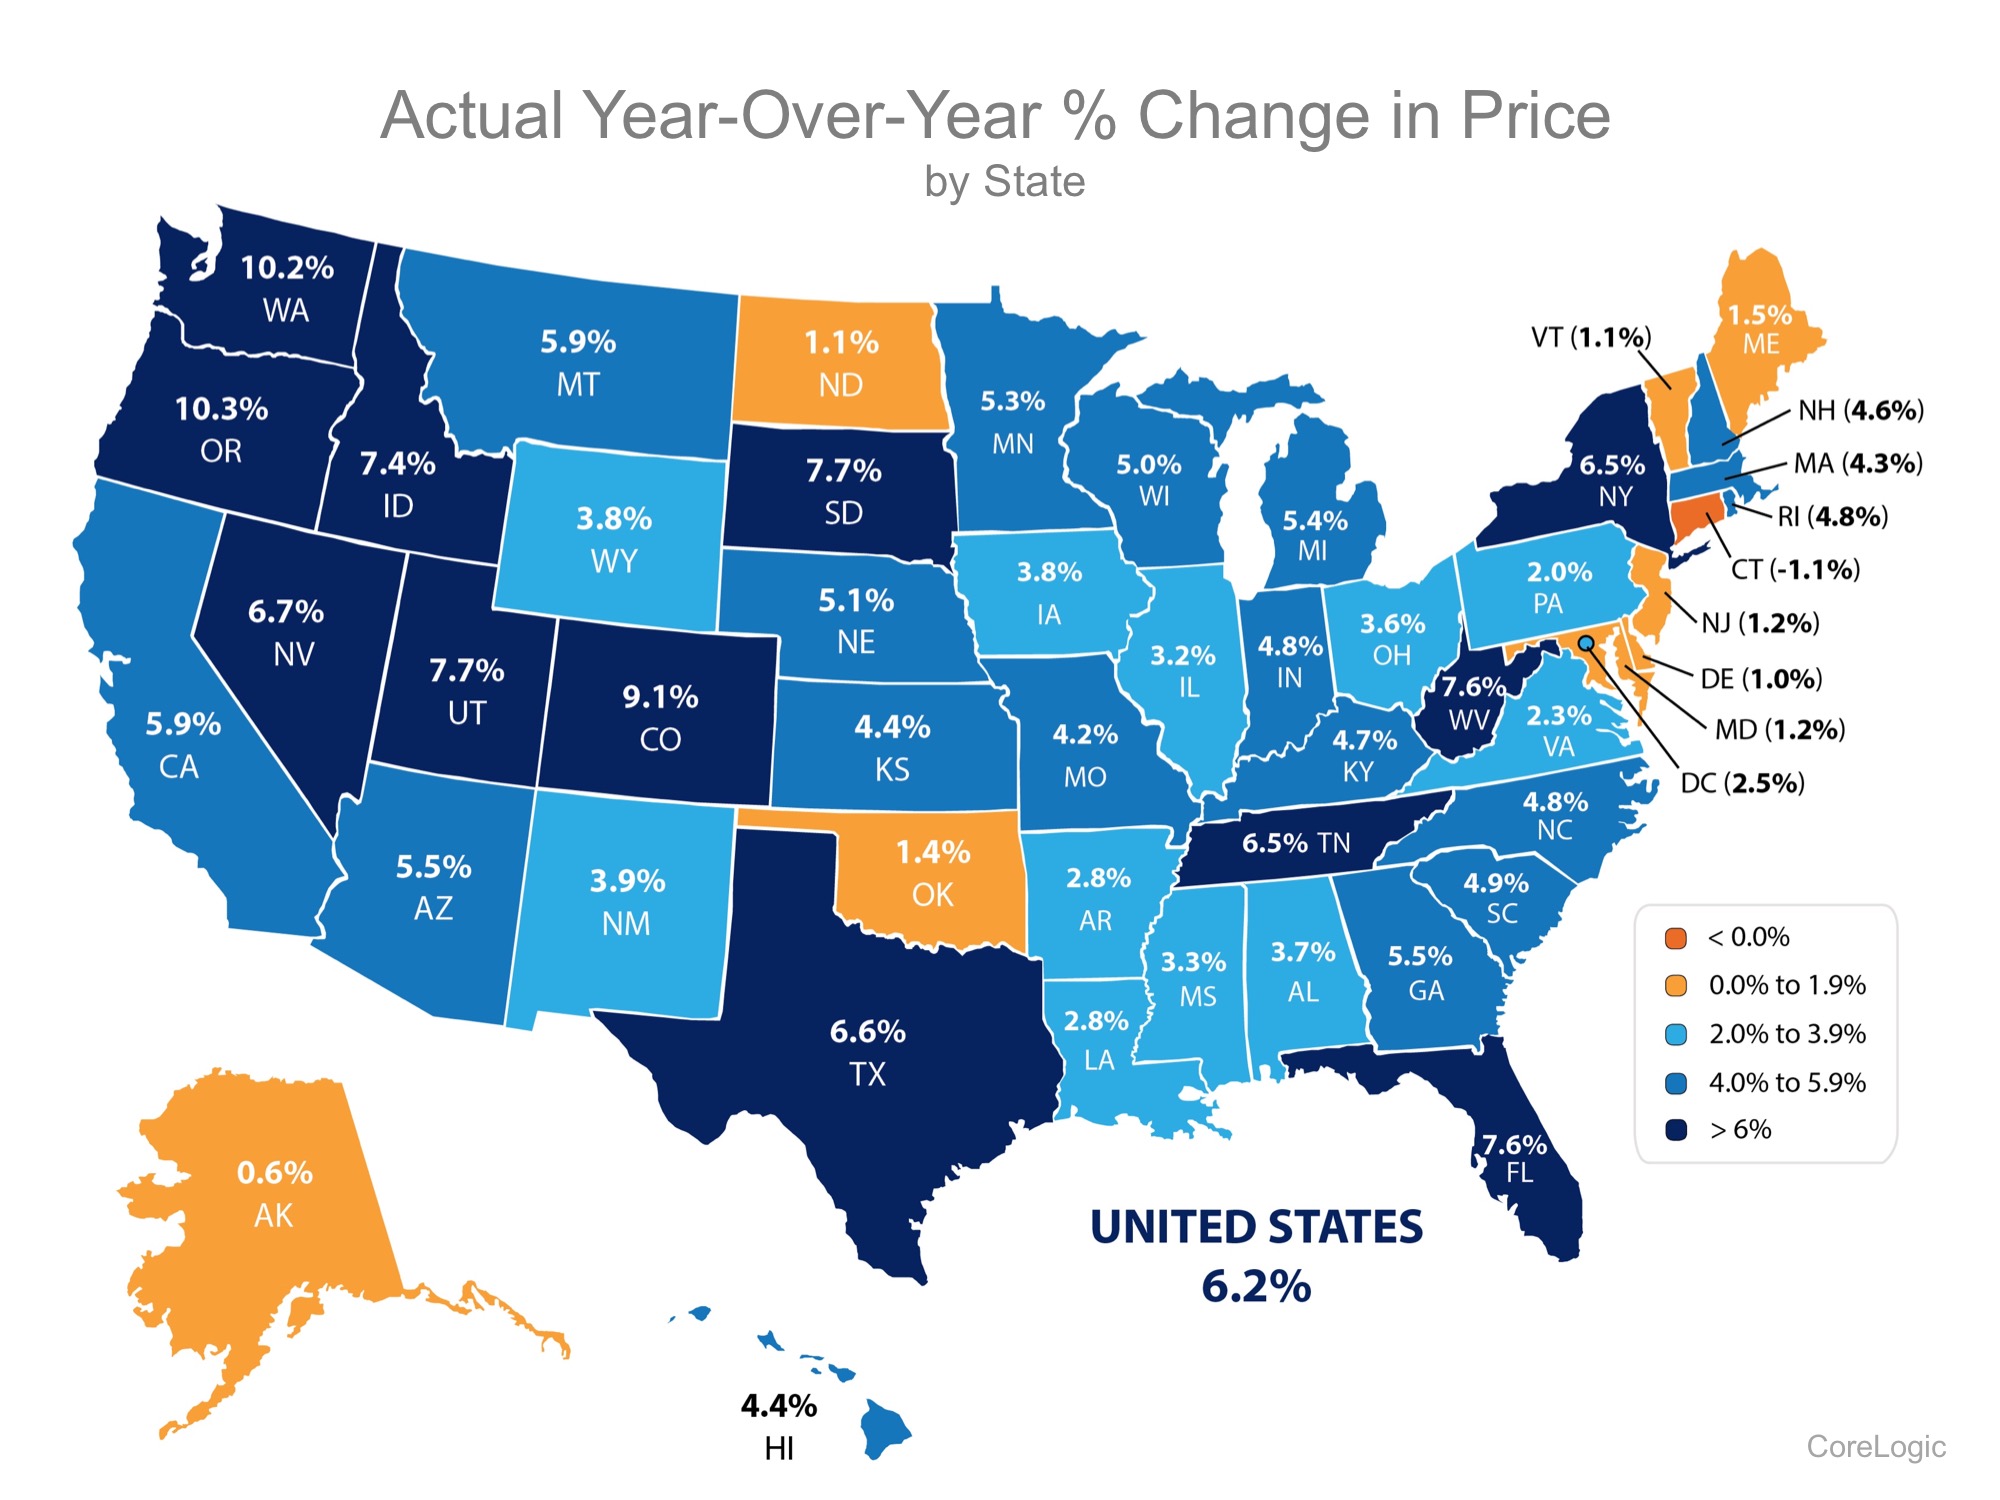
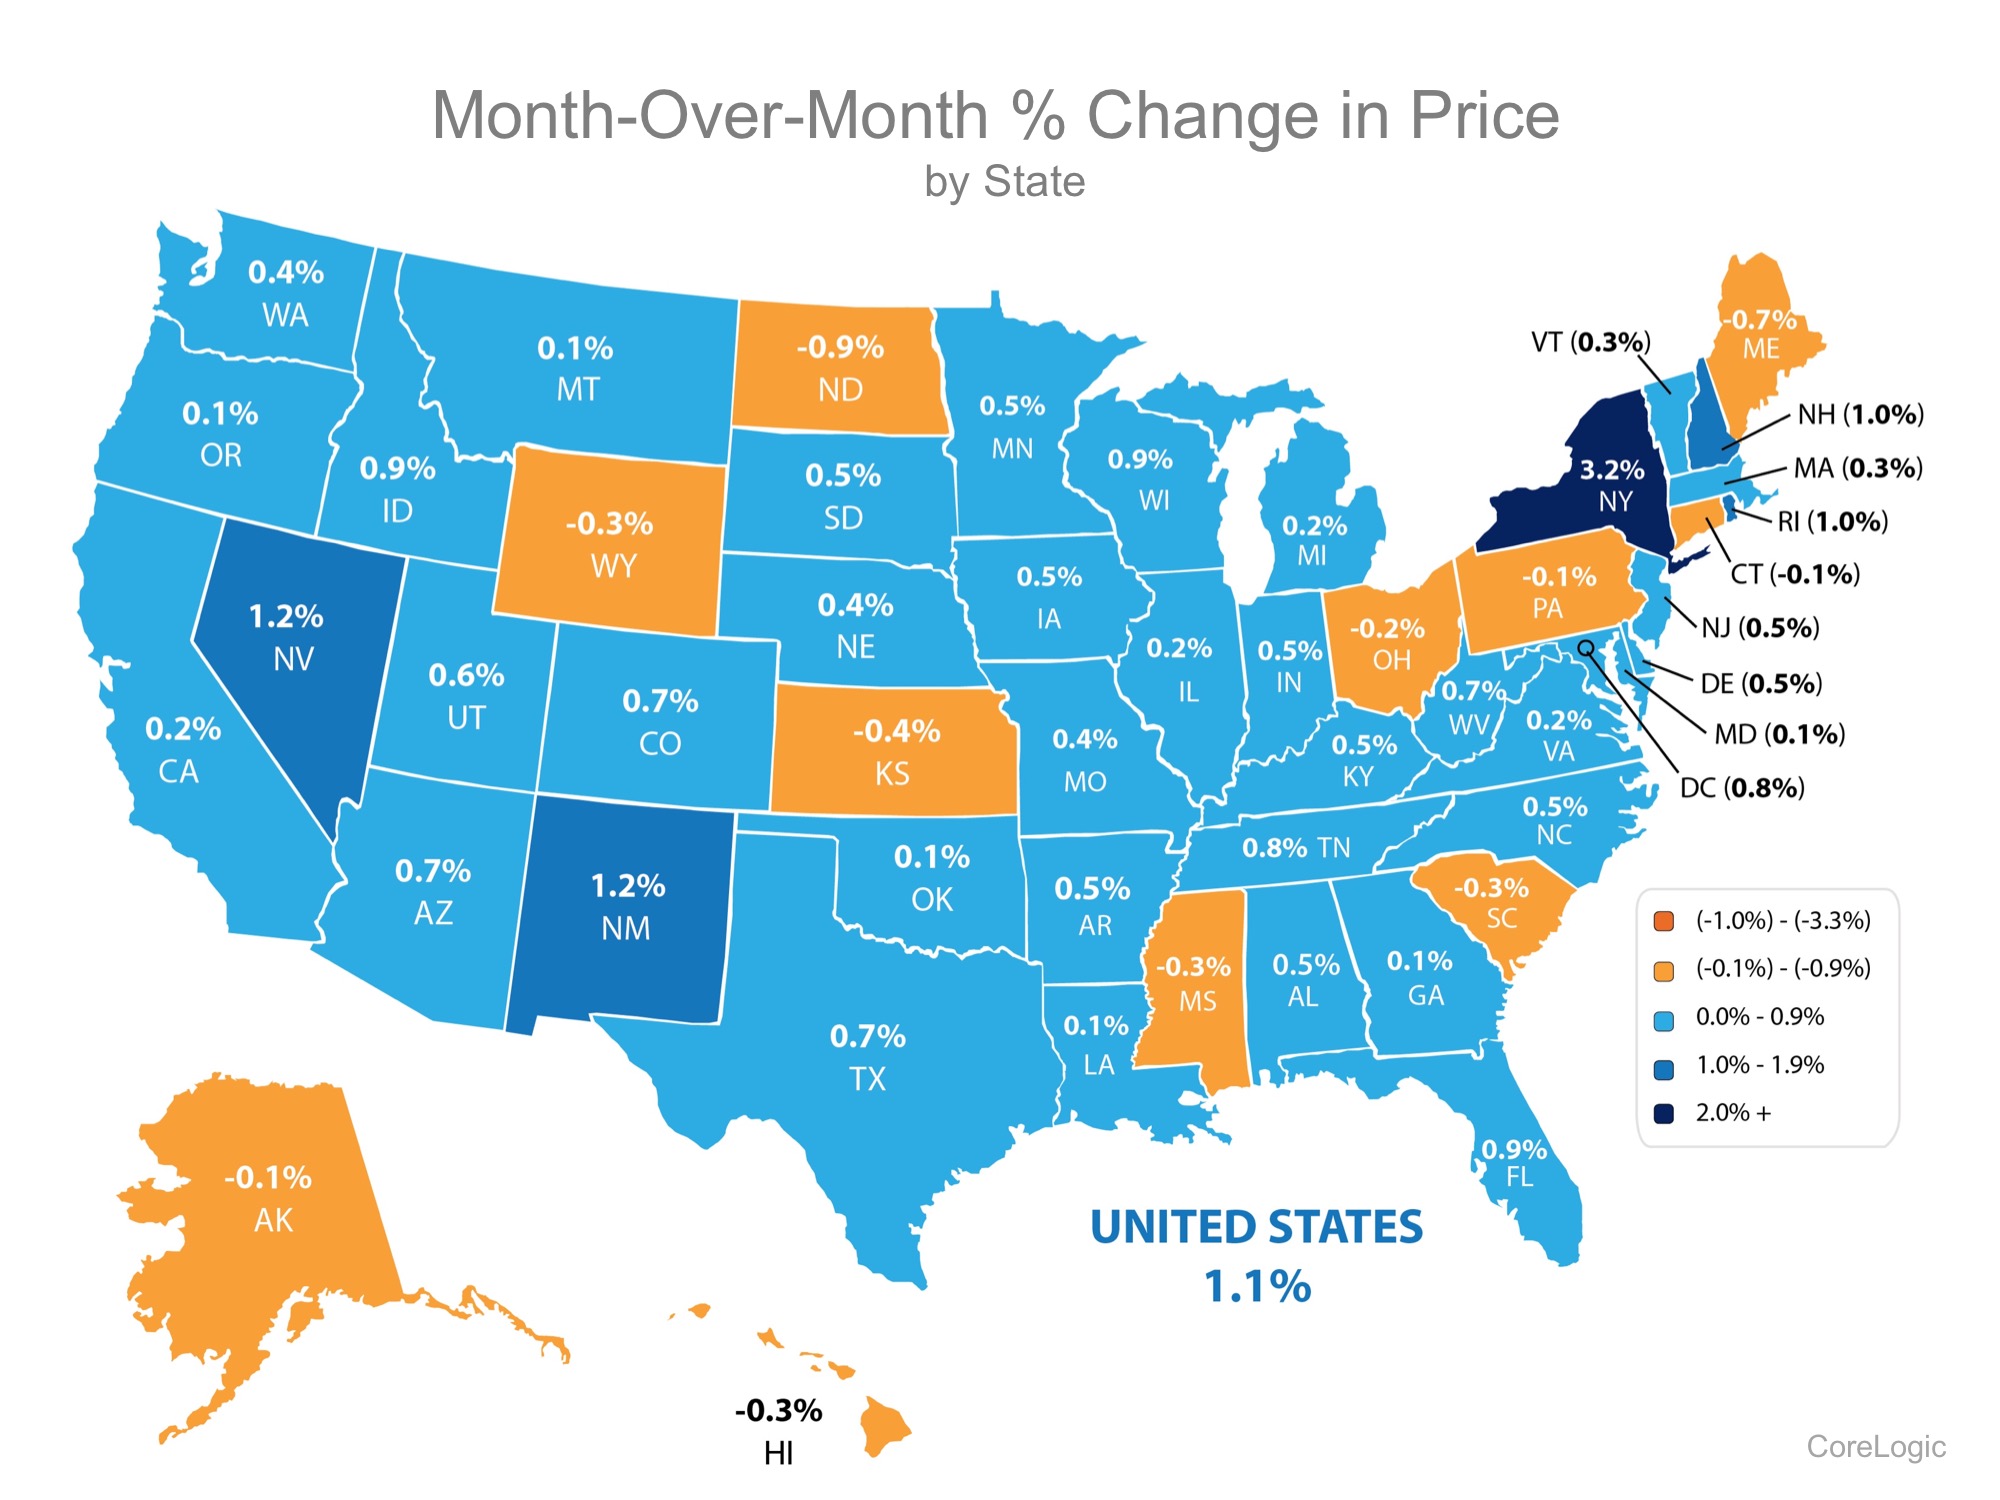
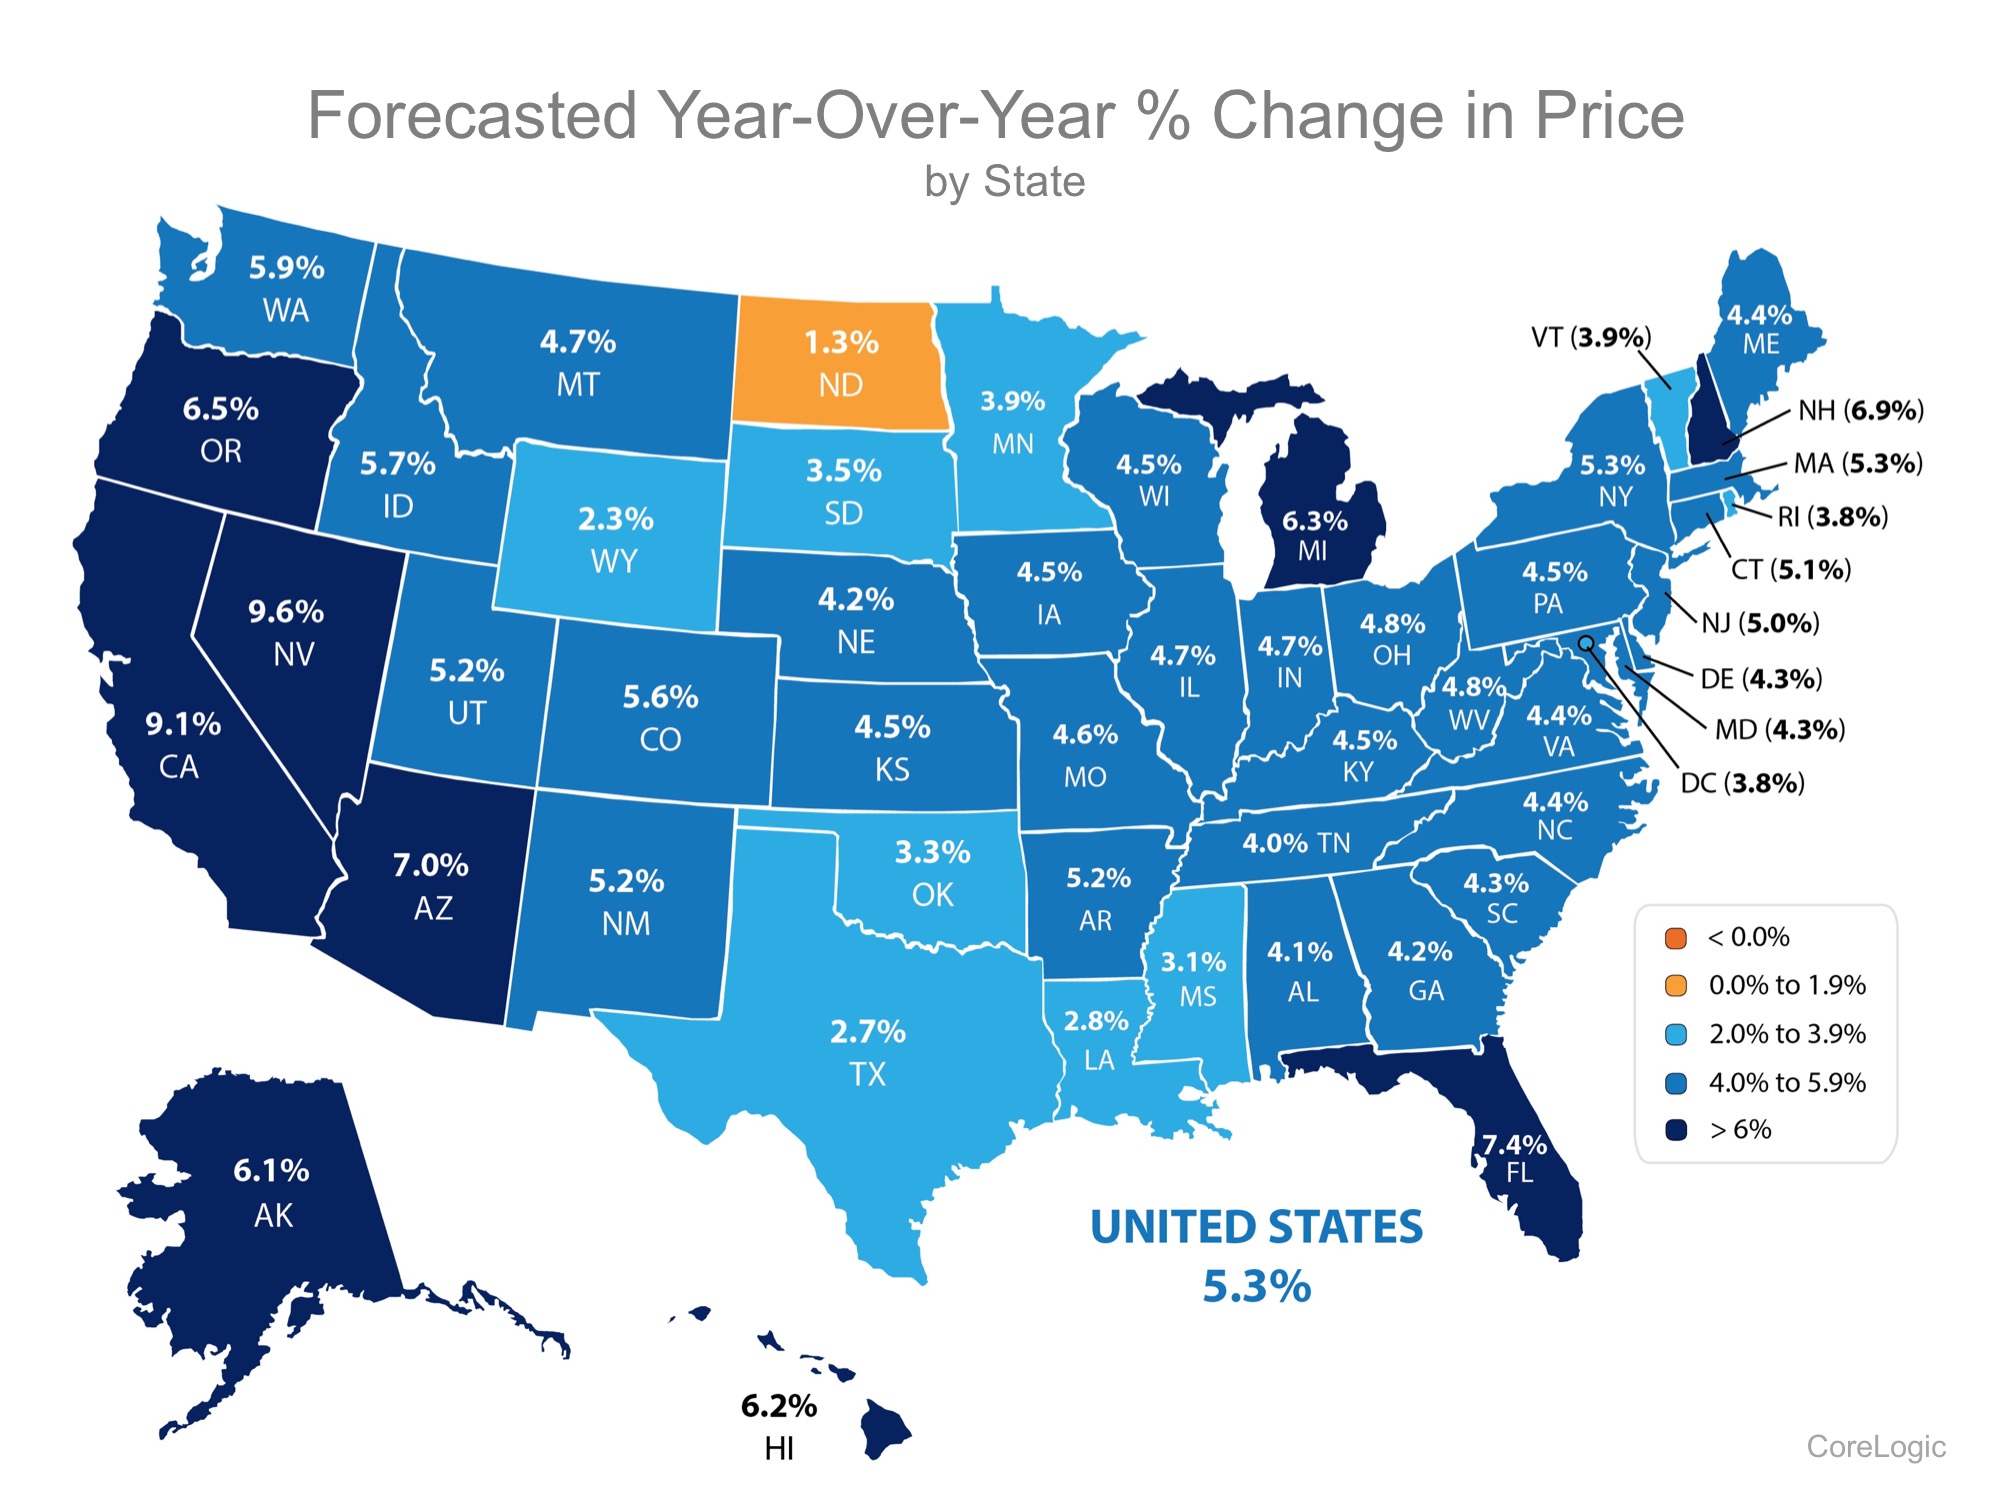
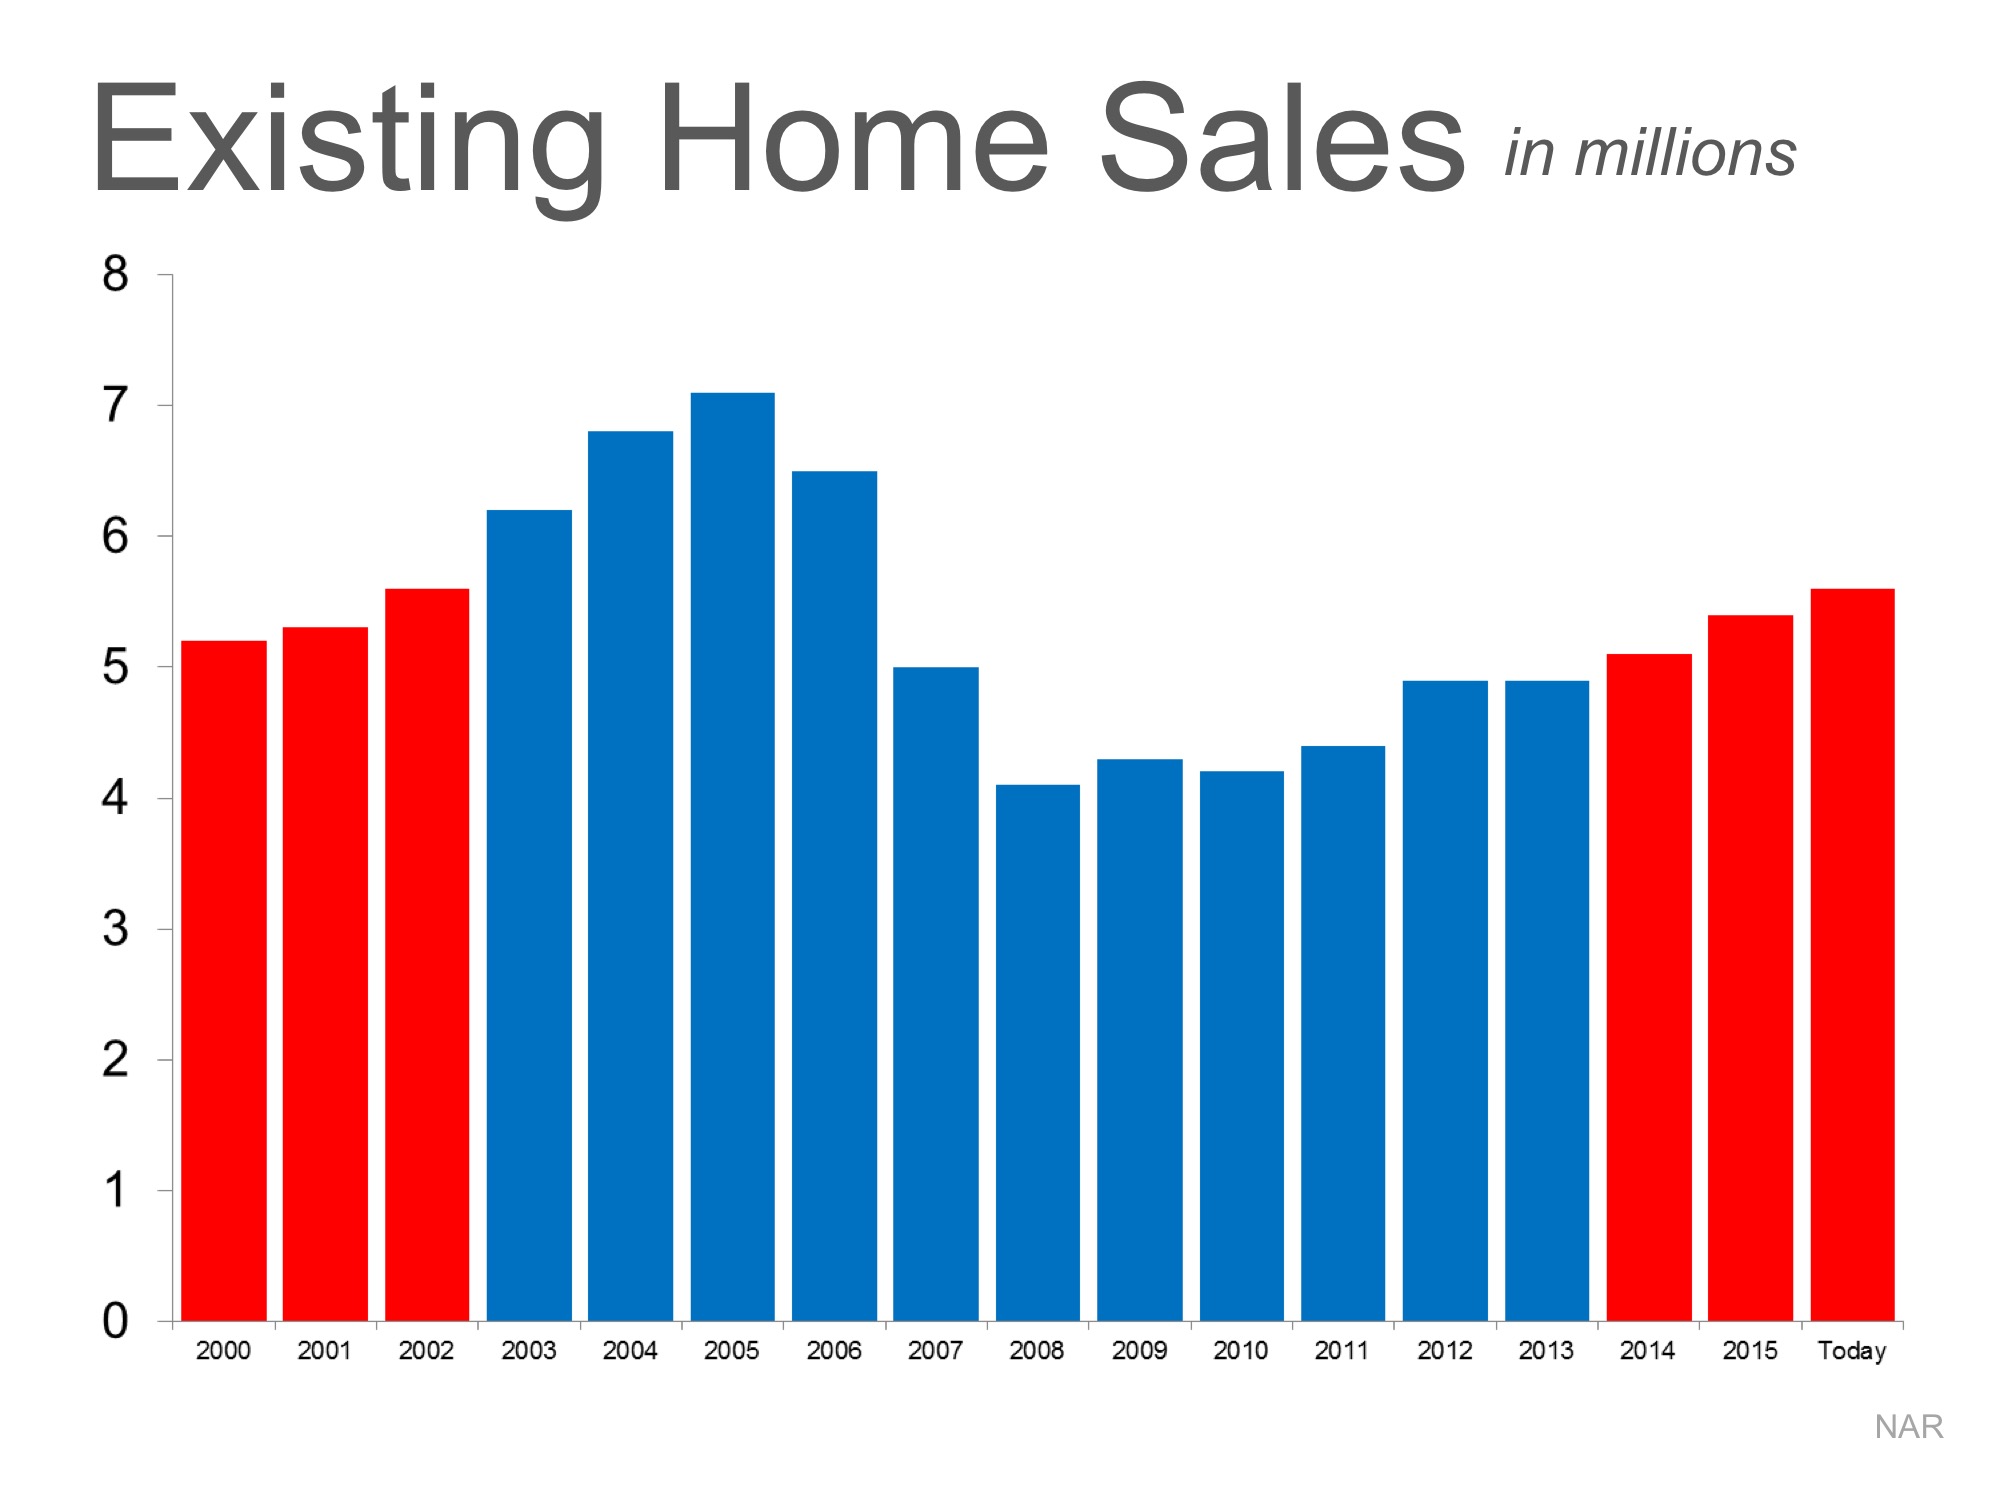
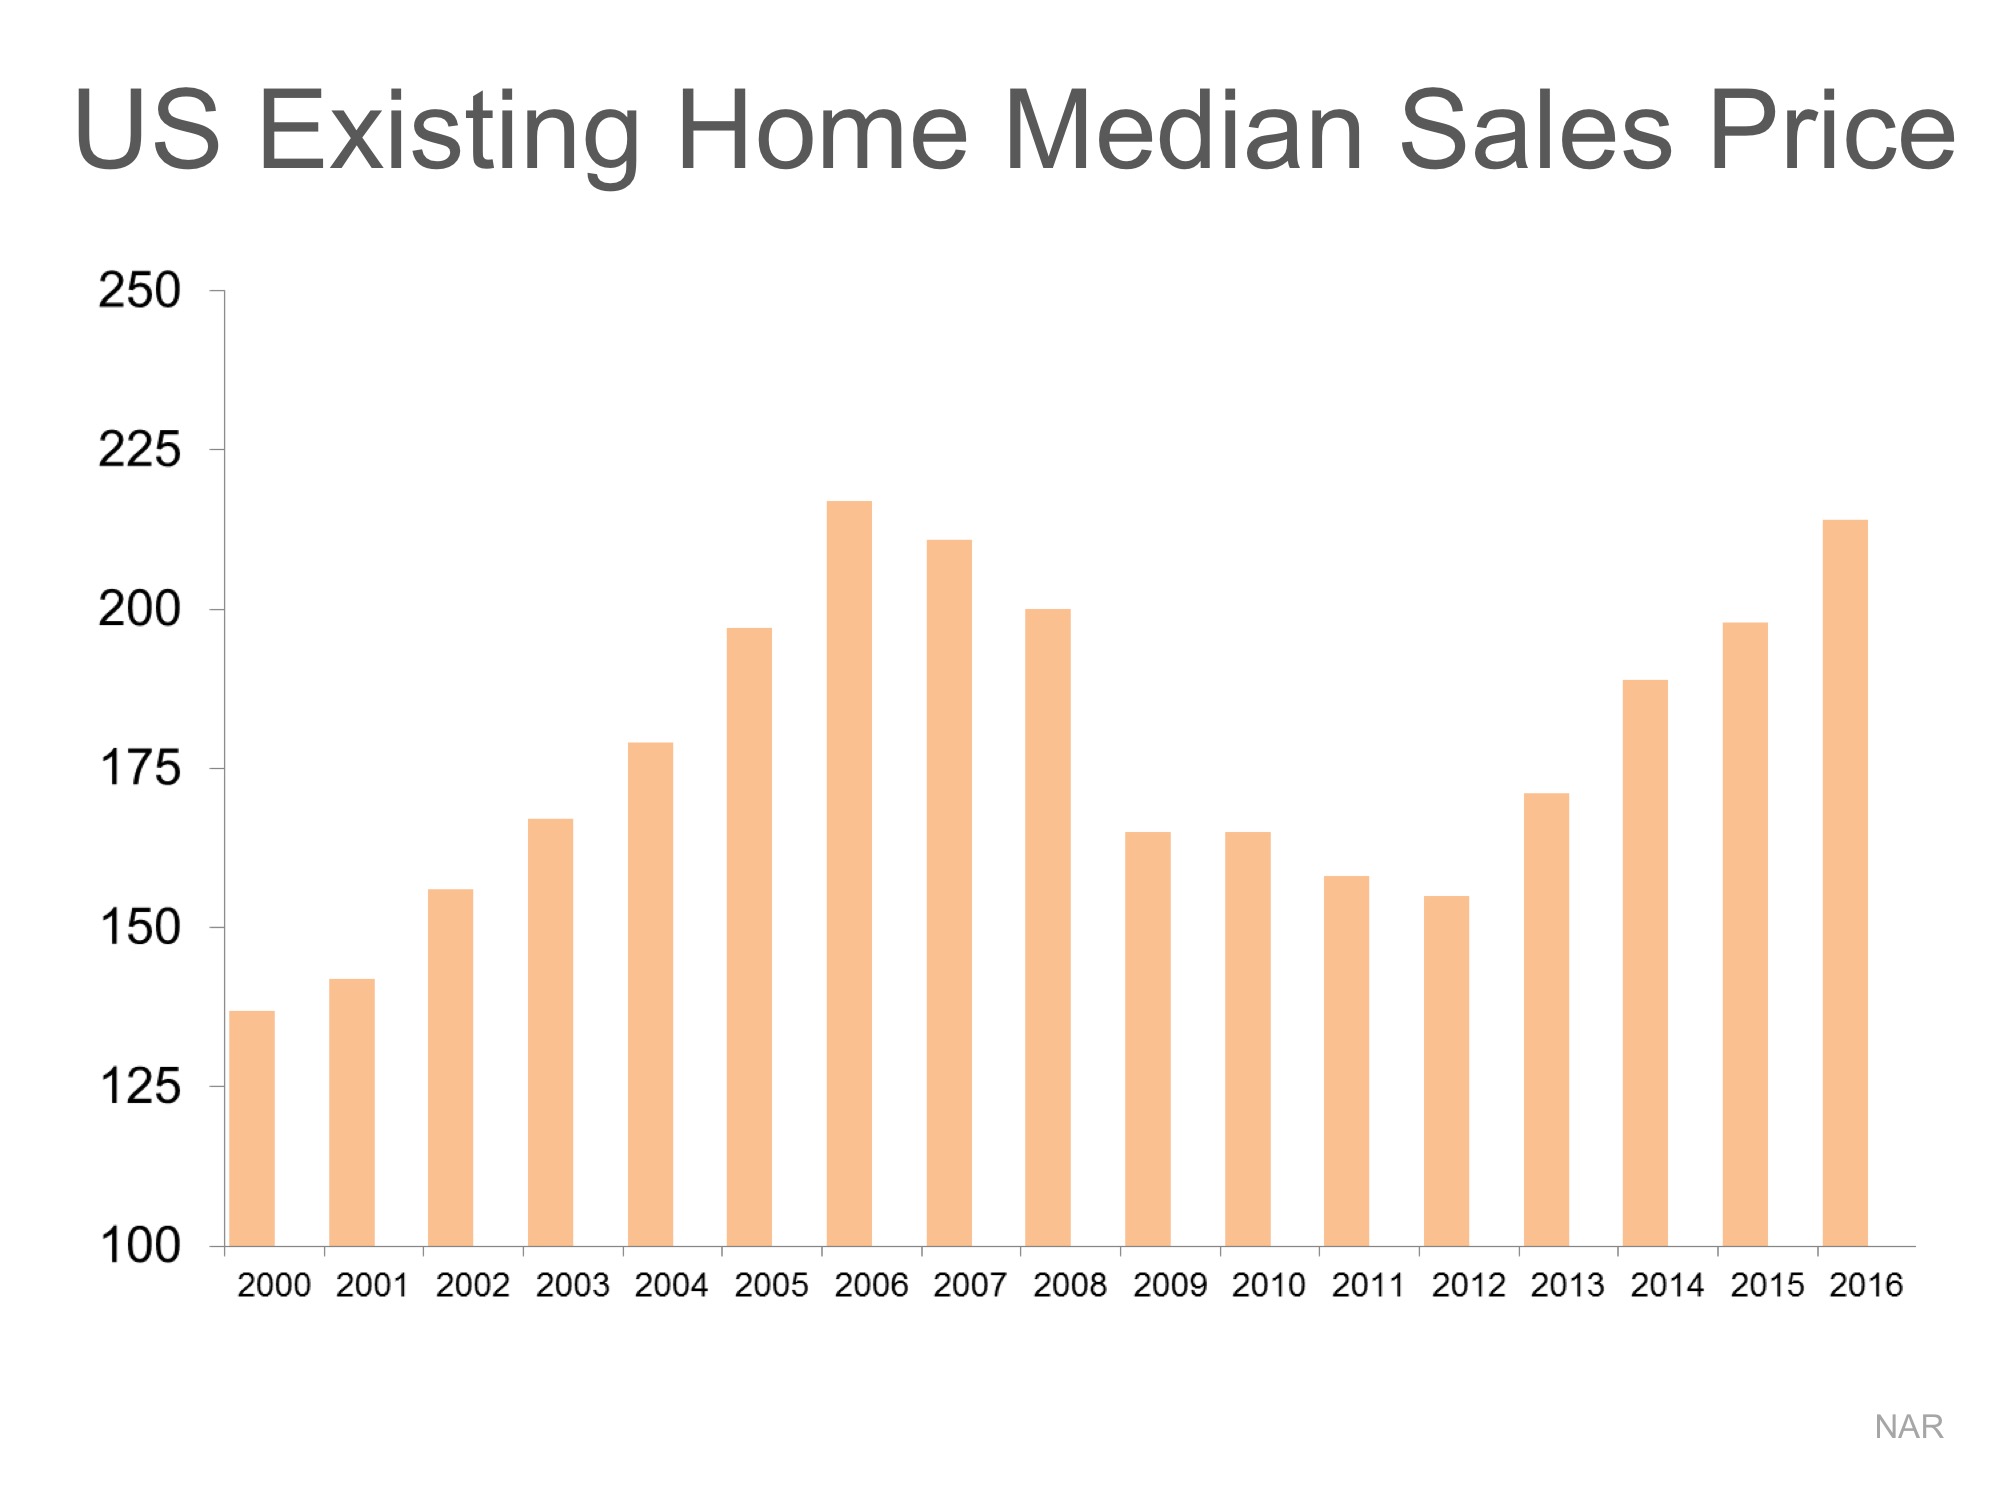
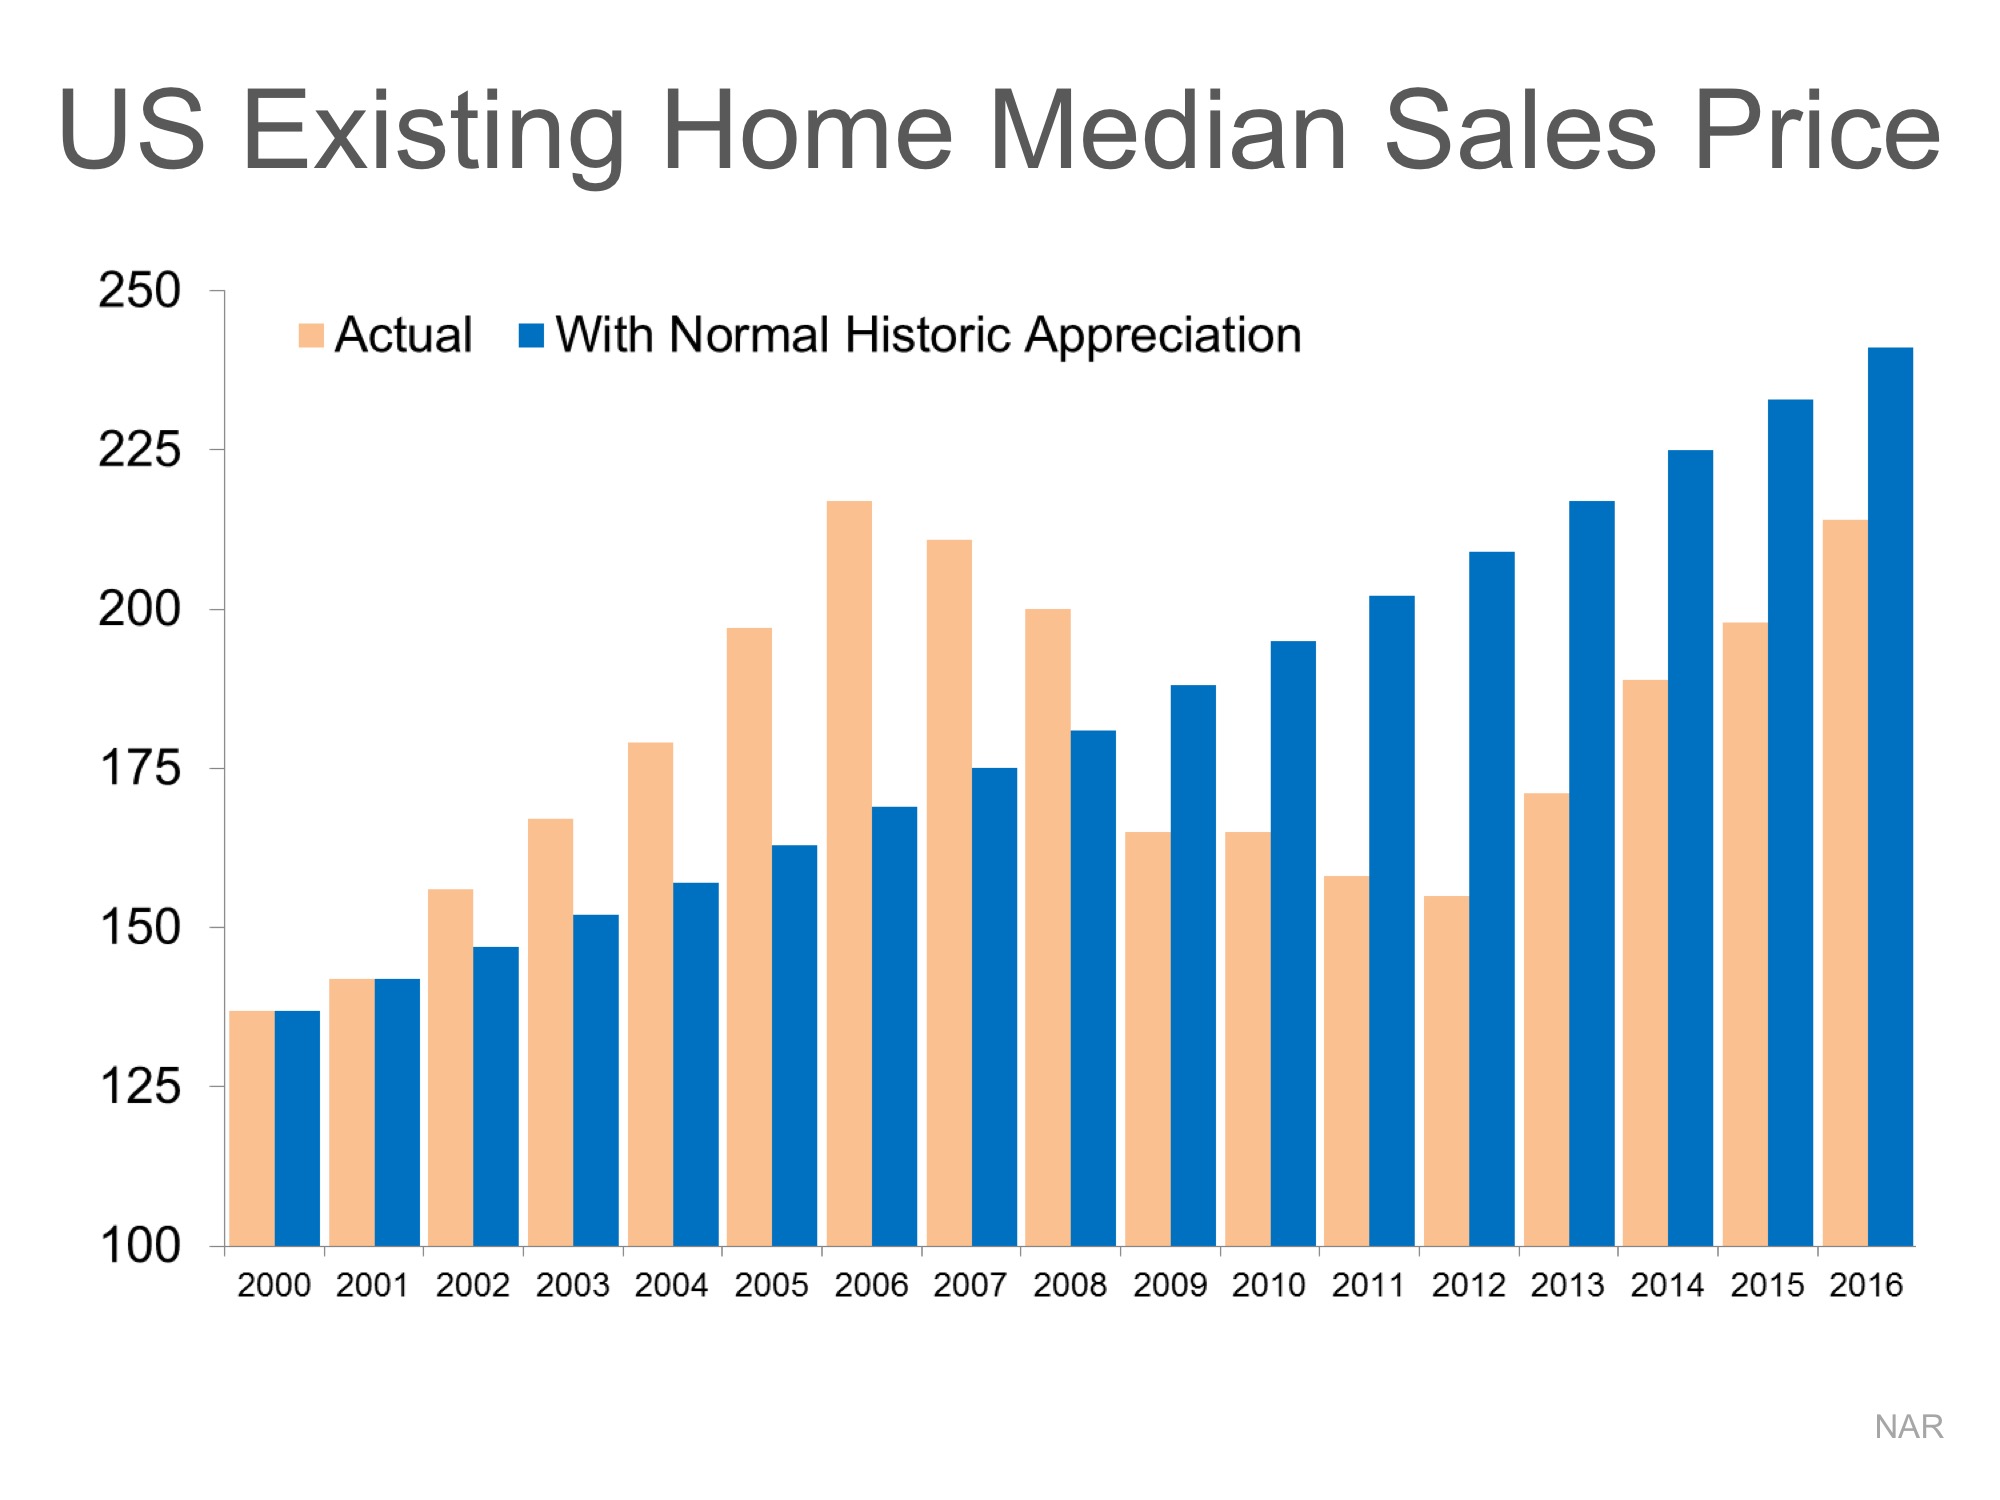
3) Home prices are well within historic norms. Prices have increased substantially over the last several years; However, those increases followed the housing crash of 2008 and national prices are still not back to 2006 levels. If there were no bubble (and subsequent bust), today’s prices would actually be lower than if they were measured by historic appreciation levels from 1987-1999.

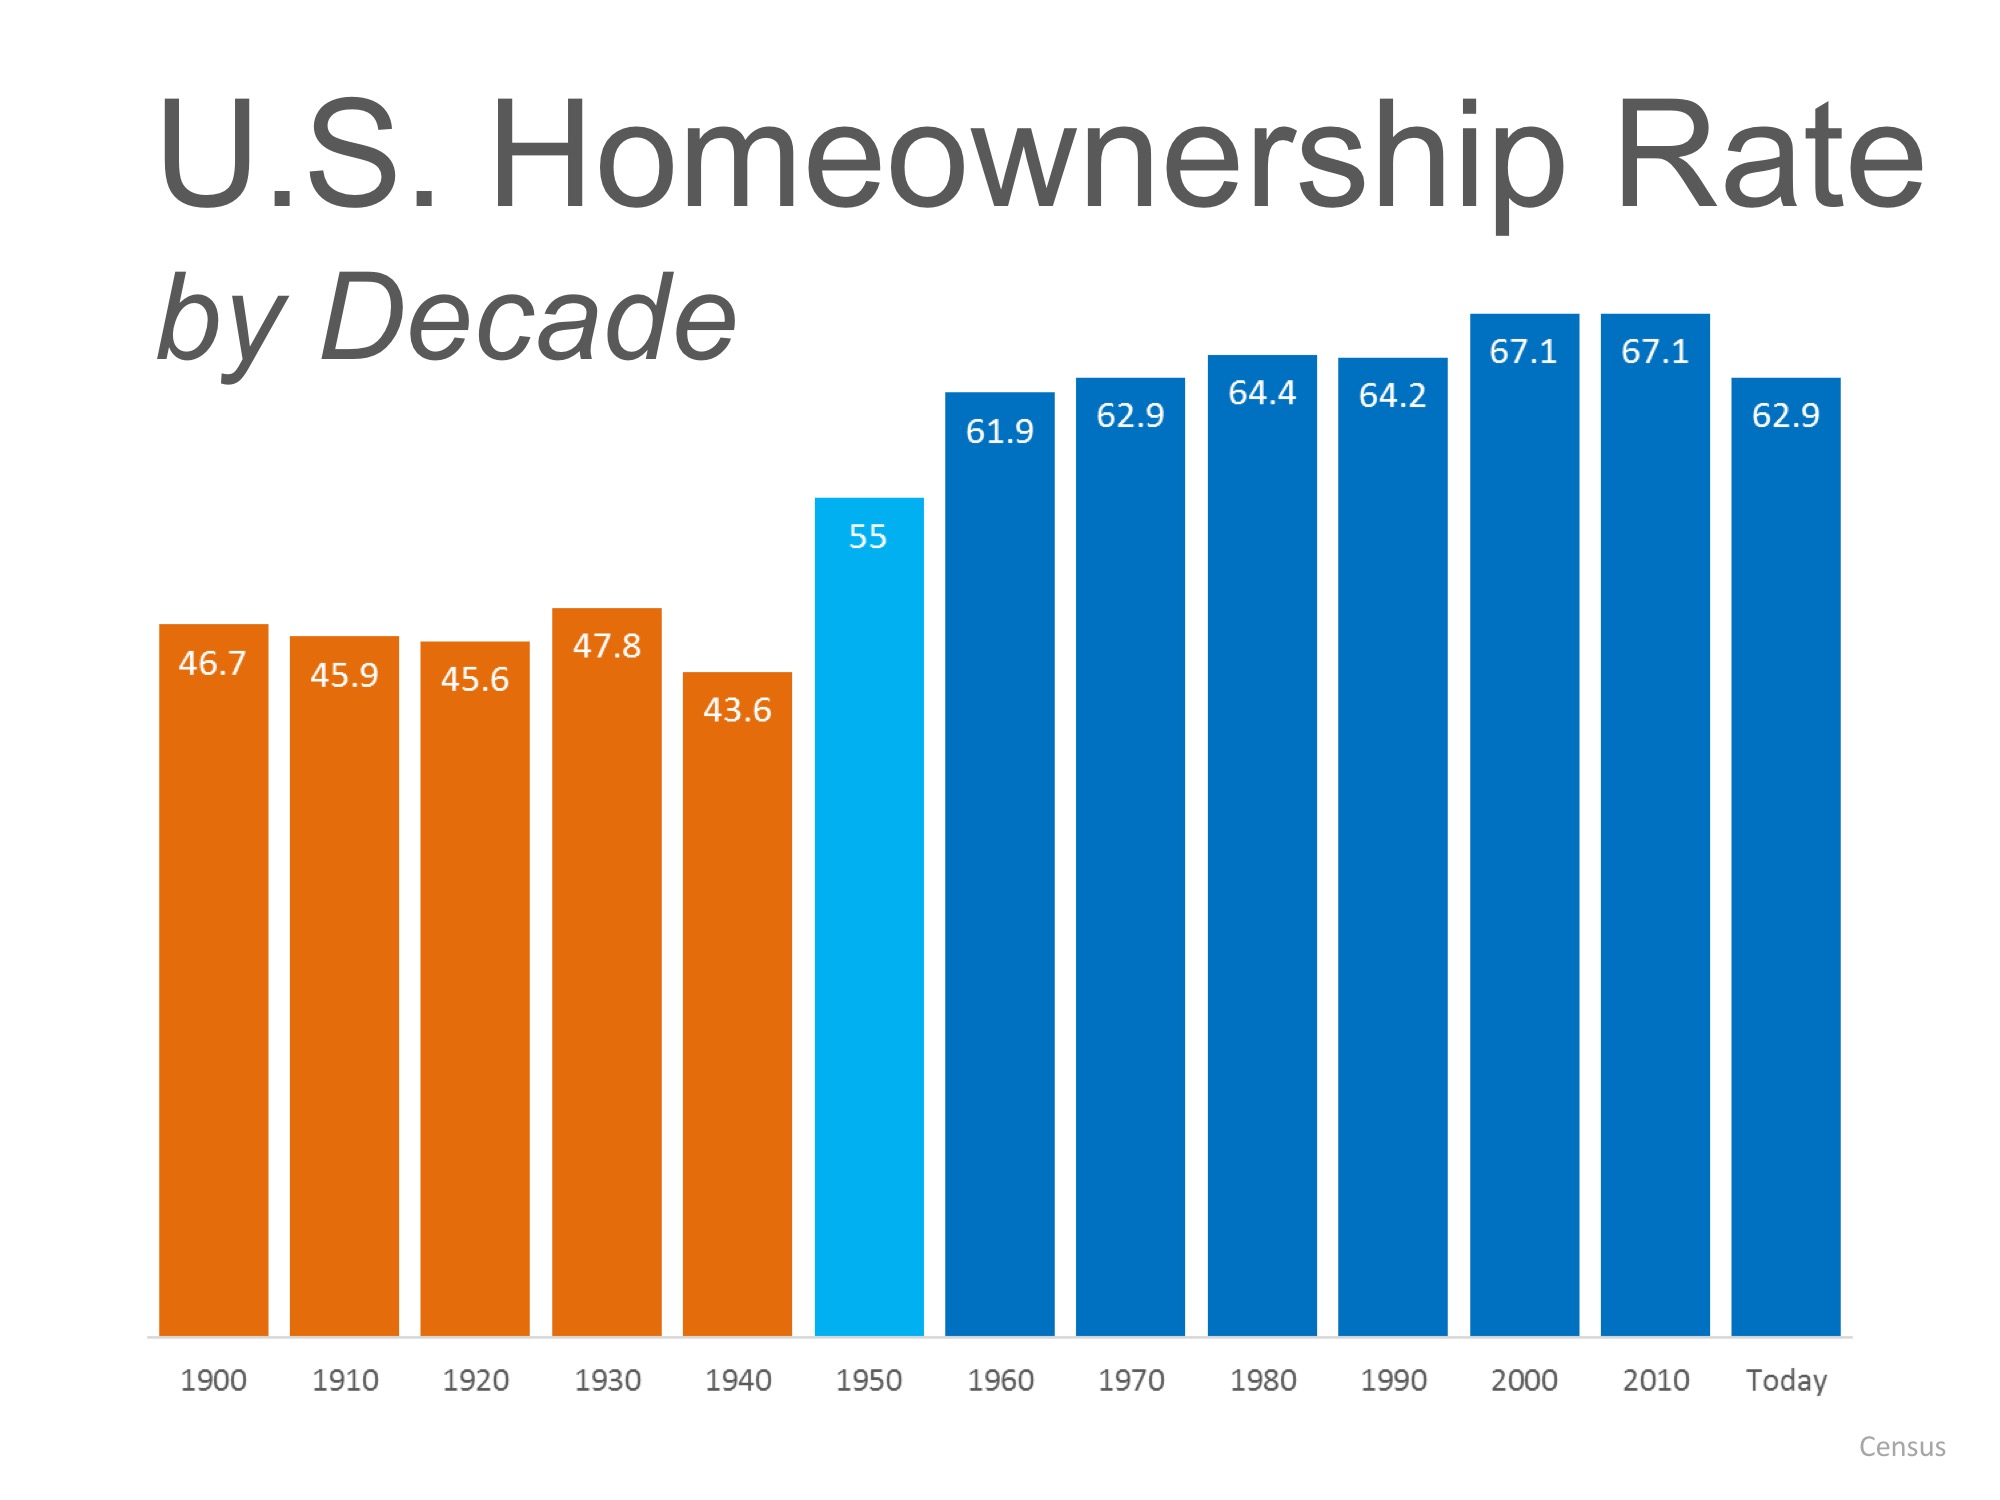
4) Demand for housing, as measured by new household formations, is growing. The Urban Land Institute projects that 5.95 million new households will be formed over the next three years. Even if the homeownership rate drops to 60%, that would be over 3.5 million new homeowners entering the market.

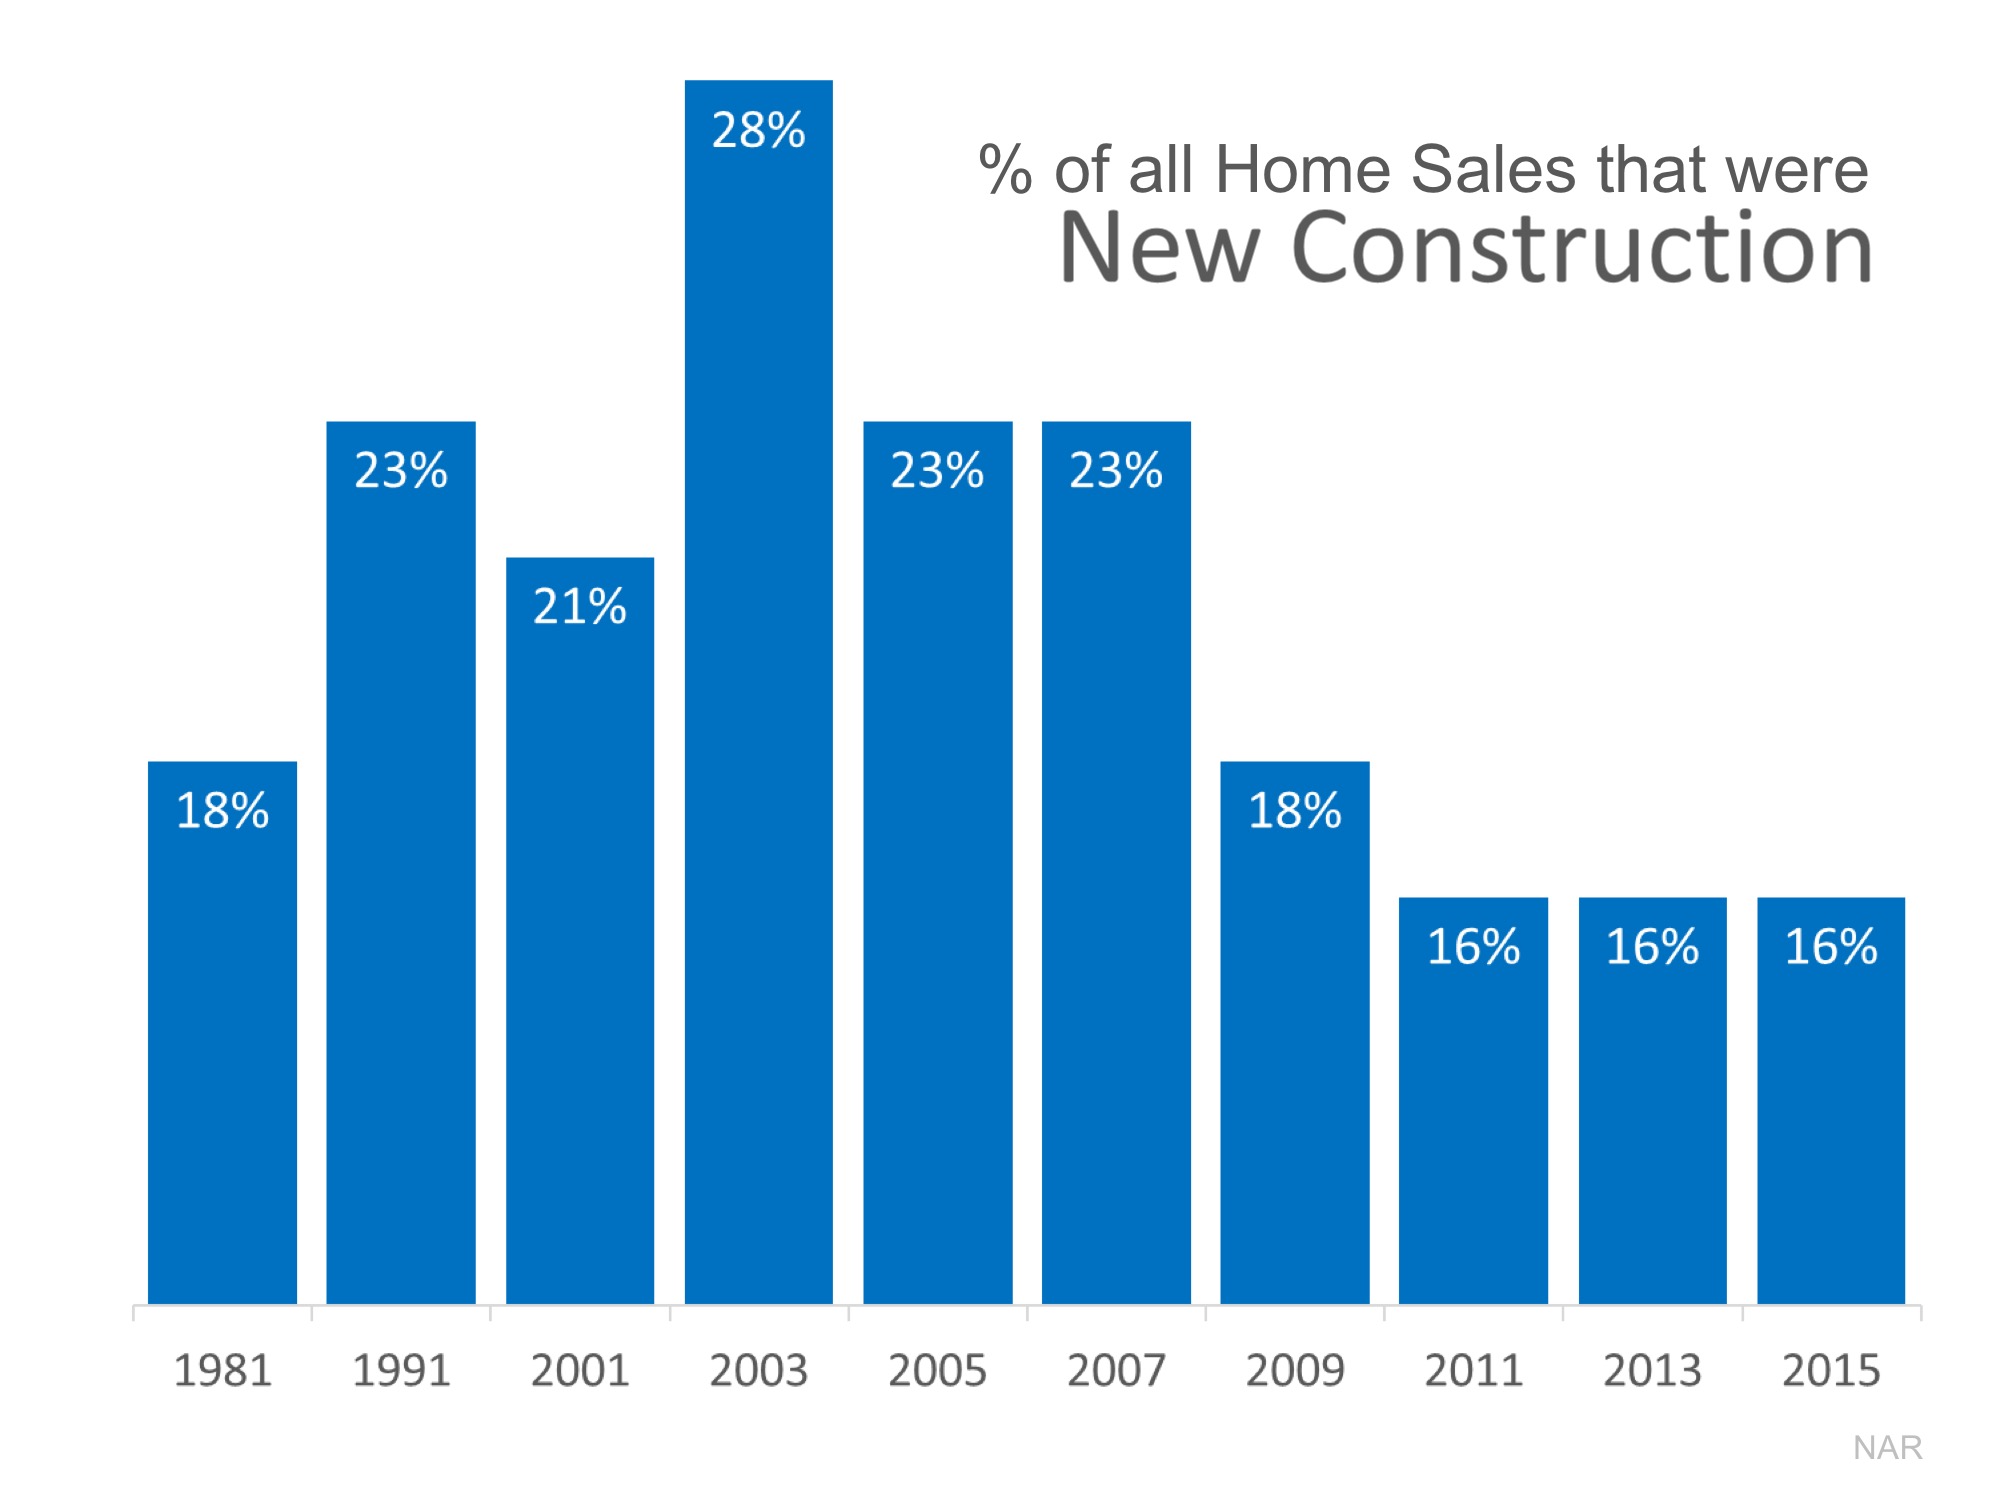
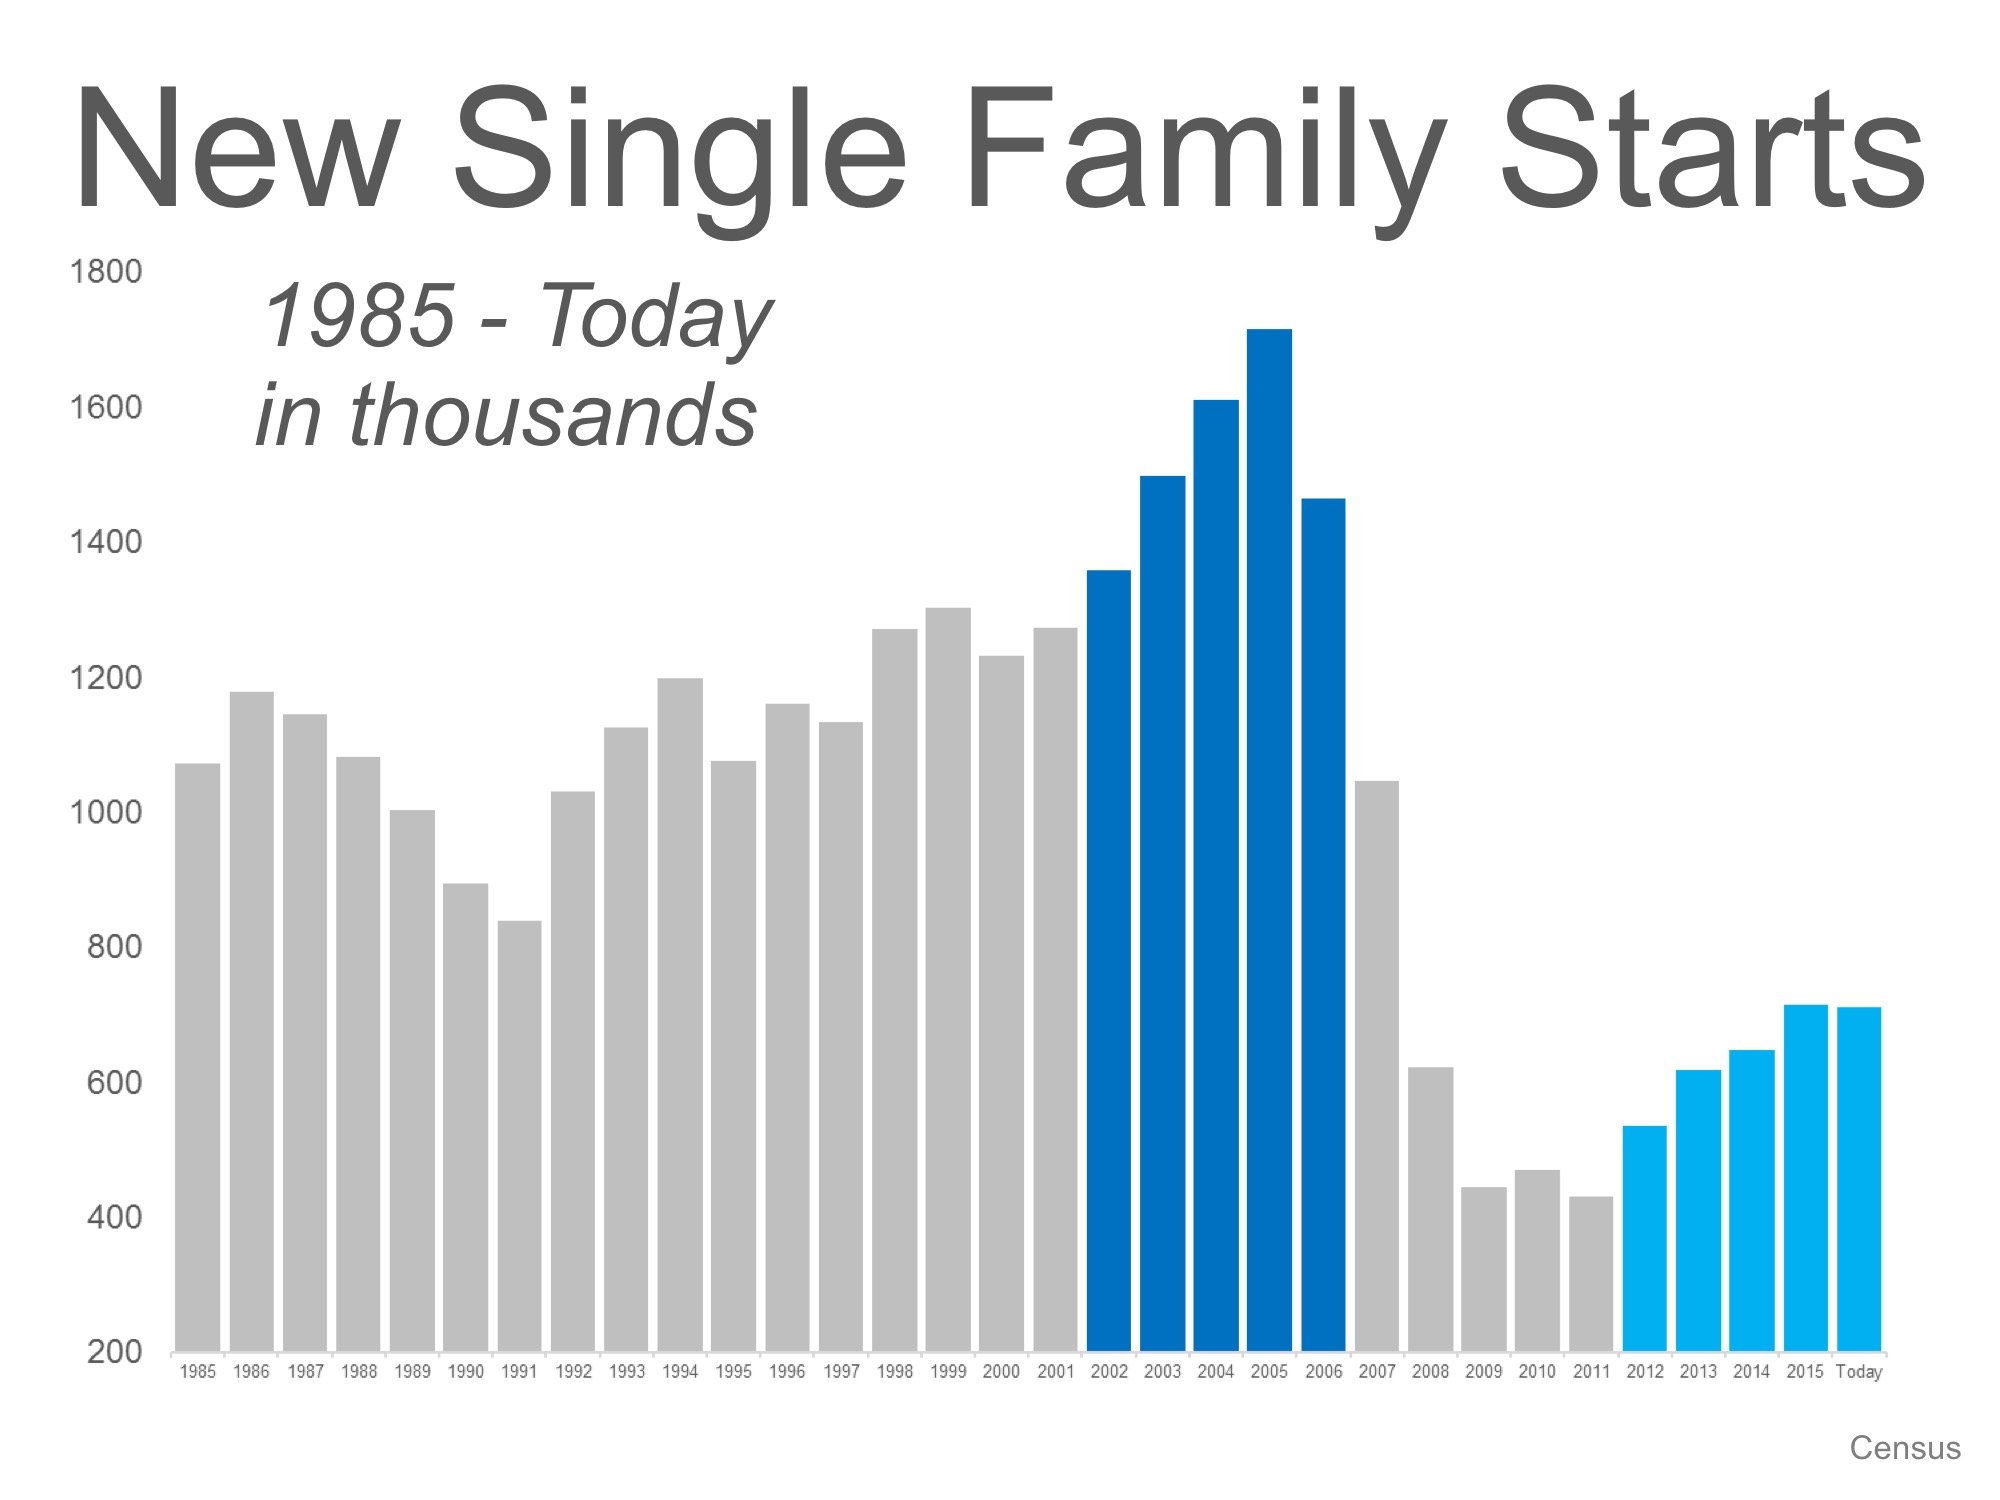
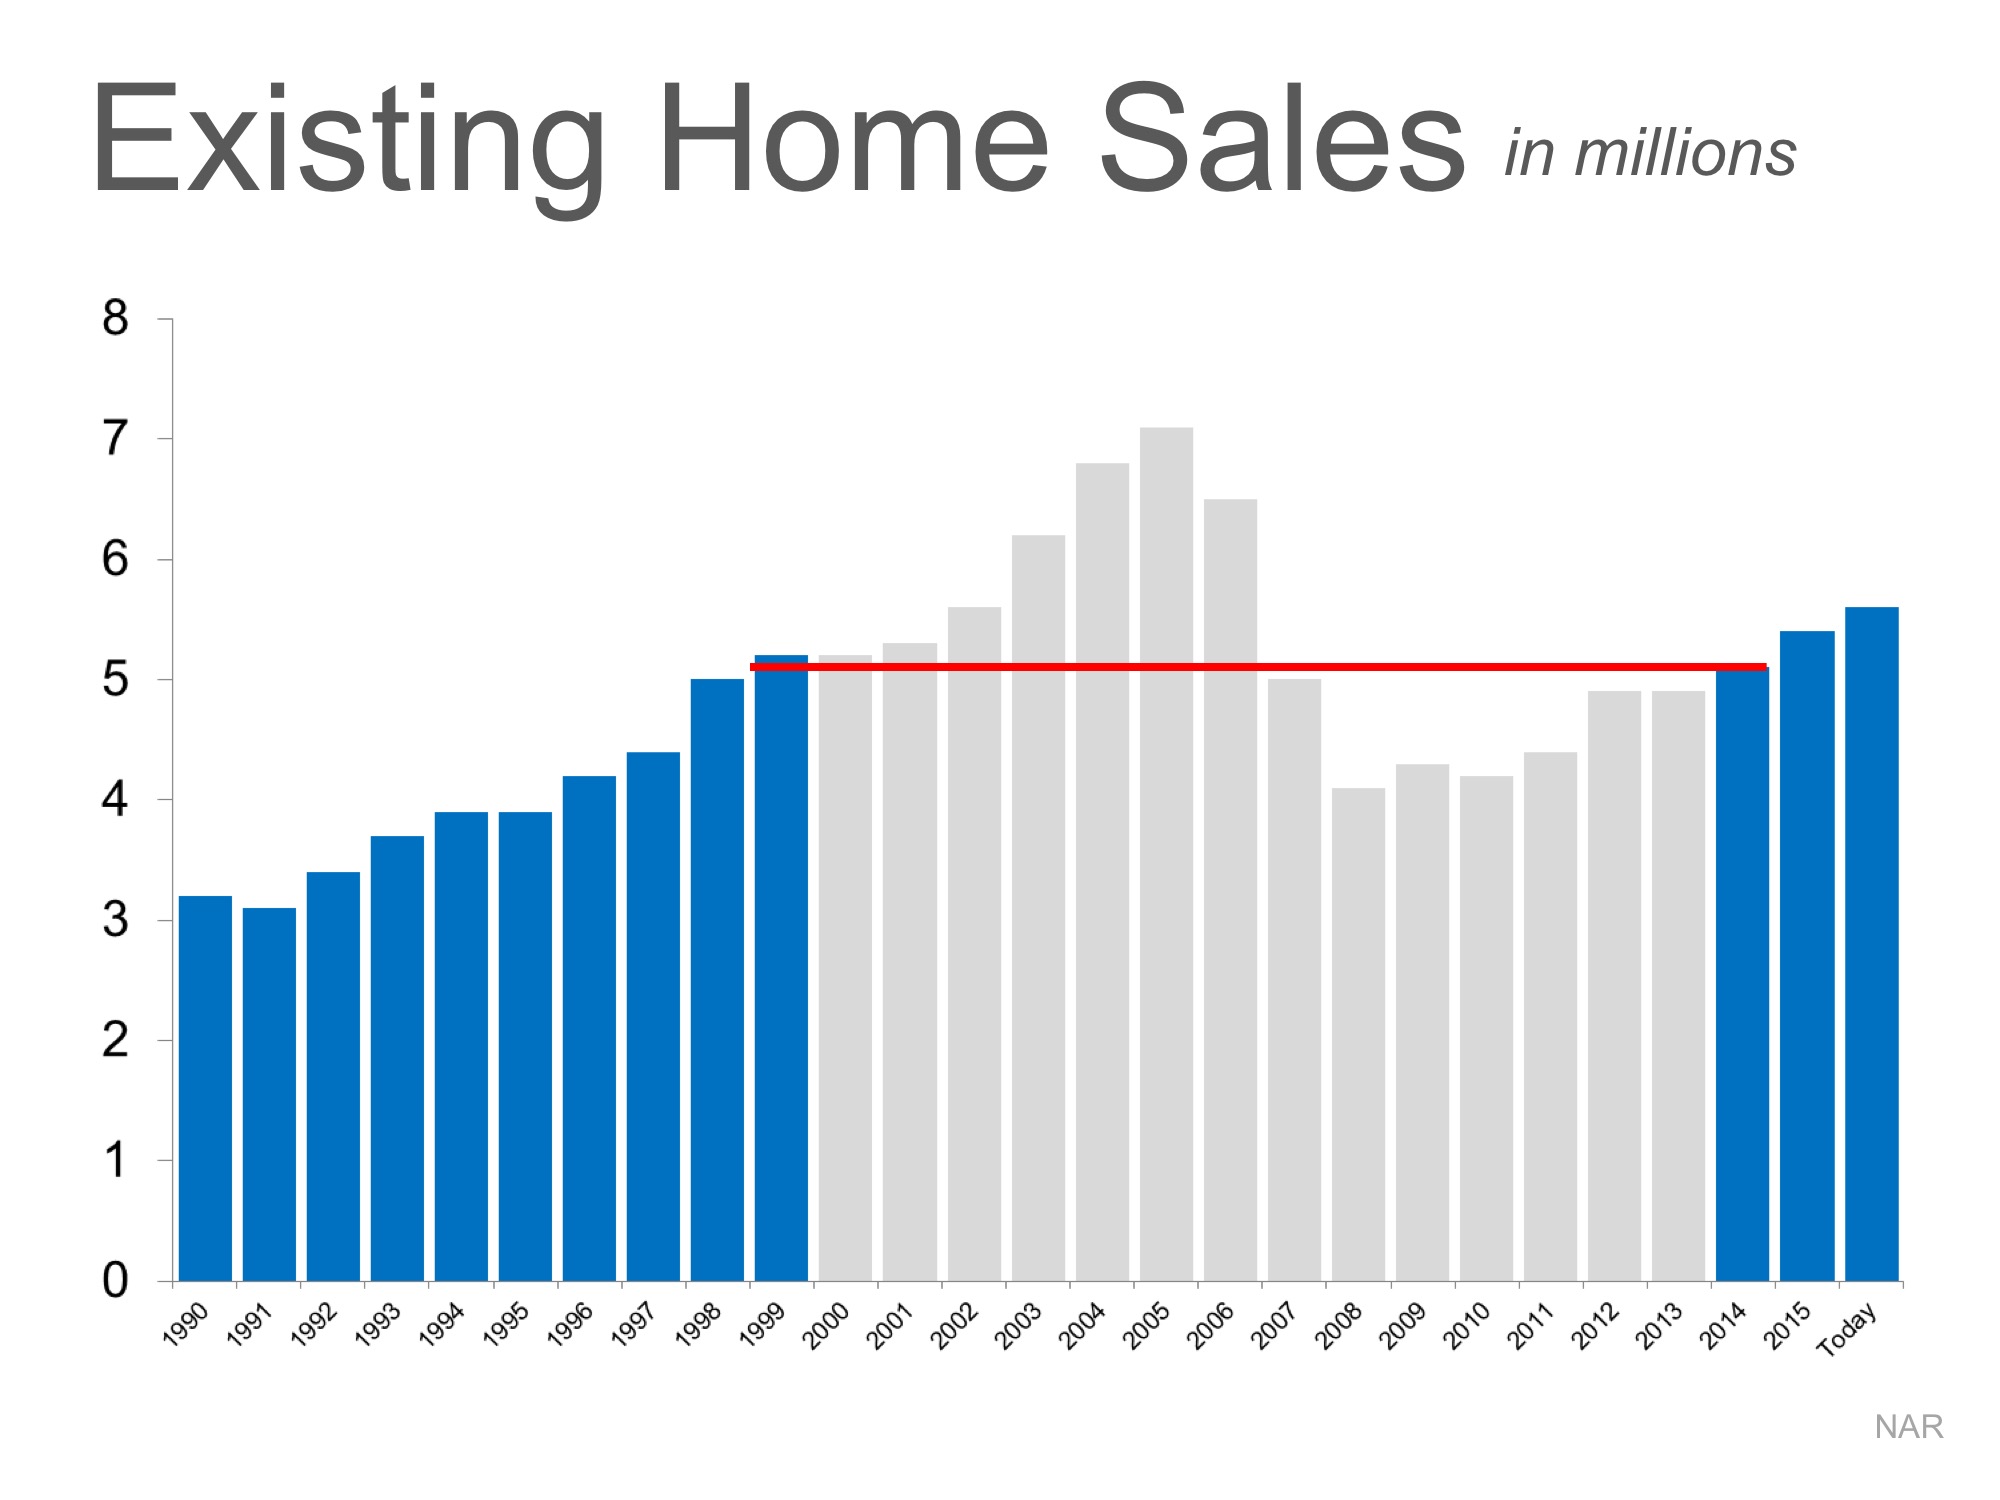
5) New home starts are finally beginning to increase. This helps eliminate the number one challenge in the industry – lack of inventory. And it does so in two ways:

  1. Some first time buyers will, in fact, purchase a newly constructed home.
  2. Many current homeowners will move-up (or move-down) to a new construction and then put their current home on the market.

This means that there will be an increase in both new construction and existing home inventories.

Strong Buyer Demand Continues to Outpace Inventory of Homes for Sale

The price of any item is determined by the supply of that item, as well as the market demand. The National Association of REALTORS (NAR) surveys “over 50,000 real estate practitioners about their expectations for home sales, prices and market conditions” for their monthly REALTORS Confidence Index.

Their latest edition sheds some light on the relationship between Seller Traffic (supply) and Buyer Traffic (demand).

Buyer Demand

The map below was created after asking the question: “How would your rate buyer traffic in your area?”

Strong Buyer Demand Continues to Outpace Inventory of Homes for Sale | Simplifying The Market

The darker the blue, the stronger the demand for homes in that area. Only four states came in with a weak or moderate demand level.

Seller Supply

The Index also asked: “How would your rate seller traffic in your area?”

As you can see from the map below, the majority of the country has weak Seller Traffic, meaning there are far fewer homes on the market than what is needed to satisfy the buyers who are out looking for their dream homes.

Strong Buyer Demand Continues to Outpace Inventory of Homes for Sale | Simplifying The Market

Bottom Line

Looking at the maps above, it is not hard to see why prices are appreciating in many areas of the country. Until the supply of homes for sale starts to meet the buyer demand, prices will continue to increase. If you are debating listing your home for sale, let’s get together and discuss the demand in our area.

Home Sales Expected to Increase Nicely in 2017

The National Association of Realtors, The Mortgage Bankers’ Association, Freddie Mac and Fannie Maeare all projecting that home sales will increase in 2017. Here is a chart showing what each entity is projecting in sales for this year and the next.

Home Sales Expected to Increase Nicely in 2017 | Simplifying The Market

As we can see, each is projecting sizable increases in home sales next year. If you have considered selling your house recently, now may be the time to put it on the market.

76% Of US Homeowners Now Have at Least 20% Equity in Their Homes!

CoreLogic’s latest Equity Report revealed that 91.1% of all mortgaged properties are now in a positive equity situation, while 75.9% now have significant equity (defined as more than 20%)! The report also revealed that 548,000 households regained equity in the second quarter of 2016 and are no longer under water.

Price Appreciation = Good News for Homeowners

Frank Nothaft, CoreLogic’s Chief Economist, explains:

“Home-value gains have played a large part in restoring home equity. The CoreLogic Home Price Index (HPI) for the U.S. recorded 5.2 percent growth in the year through June, an important reason that the number of owners with negative equity fell by 850,000 in the second quarter from a year earlier.”

Anand Nallathambi, President & CEO of CoreLogic, believes this is a great sign for the market in the coming year as well, as he had this to say:

“We see home prices rising another 5 percent in the coming year based on the latest projected national CoreLogic Home Price Index. Assuming this growth is uniform across the U.S., that should release an additional 700,000 homeowners from the scourge of negative equity.”

Below is a map illustrating the percentage of households in each state with significant equity: 

76% Of US Homeowners Now Have at Least 20% Equity in Their Homes! | Simplifying The Market

Many homeowners with more than 20% equity in their home would be able to use that equity as a down payment on either a larger home, or even a retirement home.

Bottom Line

If you are one of the many Americans who are unsure of how much equity you have in your home, don’t let that be the reason you fail to move on to your dream home this year!

50% of Houses sold in 36 Days or Less in July (Days on Market)

50% of Houses sold in 36 Days or Less in July [INFOGRAPHIC] | Simplifying The Market

Some Highlights About Days on Market:

  • The National Association of REALTORS® surveyed their members for their Confidence Index
  • The REALTORS® Confidence Index is a key indicator of housing market strength based on a monthly survey sent to over 50,000 real estate practitioners. Practitioners are asked about their expectations for home sales, prices and market conditions.
  • Homes sold in less than 60 days in 38 out of 50 states and Washington D.C.
  • Homes sold in less than 30 days in 17 states

Mortgage Standards Easing TOO MUCH? NO!!

There is no doubt that getting a mortgage is easier today than it was right after the housing crash a decade ago. However, the easing of credit availability has led to some questioning of whether or not we are headed for another housing crisis.

Let’s put everything into the proper perspective.

Mortgage Credit Availability Over the Last Three Years

Getting a home mortgage has definitely gotten easier over the last three years as evidenced by theMortgage Credit Availability Index, issued by the Mortgage Bankers Association, in the following graph (the higher the index, the easier it is to get a mortgage):

Mortgage Standards Easing TOO MUCH? NO!! | Simplifying The Market

However, if we look further back at the index we see quite a different story.

Mortgage Credit Availability Today Compared to 2006

The graph below shows the index going back to 2004, and the first graph we showed you above is represented by the small, orange, triangular section all the way in the lower-right corner.

Mortgage Standards Easing TOO MUCH? NO!! | Simplifying The Market

As this visual easily illustrates, today’s index is nowhere near the levels it shot up to in 2006.

Bottom Line

Mortgage credit is definitely easing. However, we are not coming close to the lax standards that caused the housing crisis of last decade.

Home Prices Up 5.61% Across The Country!

Home Prices Up 5.61% Across The Country! [INFOGRAPHIC] | Simplifying The Market

Some Highlights:

  • The Federal Housing Finance Agency (FHFA) recently released their latest Quarterly Home Price Index report.
  • In the report, home prices are compared both regionally and by state.
  • Based on the latest numbers, if you plan on relocating to another state, waiting to move may end up costing you more!
  • Vermont was the only one state where home prices are actually lower than they were last year.

New Construction Numbers: Now Versus 2005

There is some thinking that the pace of the housing recovery is unsustainable and that we may be heading for another housing bubble. However, Jonathan Smoke, the Chief Economist of realtor.comexplains the basic difference between 2005 and today:

“The havoc during the last cycle was the result of building too many homes and of speculation fueled by loose credit. That’s the exact opposite of what we have today.”

If we look at the number of new single family housing starts over the last 30 years, we can see that the numbers of housing starts during the current recovery (2012-Today) are still way below historic averages, and are far less than the numbers built during the run-up to the housing bubble (2002-2006).

New Construction Numbers: Now Versus 2005 | Simplifying The Market

A single family housing start is defined as “the number of permits issued for construction of new single family housing units. Housing starts are an important economic indicator due to its extensive spill over benefits for the other sectors of the economy (retail, manufacturing, utilities).”

Bottom Line

Current demand for housing actually calls for more new construction to be built – not less. We should at least return to historically normal levels.

Is the Current Pace of Home Sales Sustainable?

There are some experts questioning whether the current pace of residential home sales is sustainable. Are too many people buying homes like in 2004-2006? Are we headed for another housing crisis? Actually, if we look closely at the numbers, we can see that we are looking at a very healthy real estate market.

Why the concern?

Some are looking at the last three years of home sales and comparing them to the three years just prior to the housing bubble. Looking at the graph below, we can understand that thinking.

Is the Current Pace of Home Sales Sustainable? | Simplifying The Market

However, if we go further back in history, we can see the real picture. After taking out the “boom & bust” years, the pace of sales is growing at a quite natural pace.

Is the Current Pace of Home Sales Sustainable? | Simplifying The Market

And new home sales are way below historic numbers. Trulia’s Chief Economist Ralph McLaughlin explains:

“Adjusted for population, [new home sales] are at about 63% of their fifty-year average level—way better than 2011, but nowhere near heated.”

Bottom Line

The current pace of residential home sales definitely seems sustainable.

The Housing Market is Doing Just Fine

There are some that think that housing affordability is a challenge. Historically, that’s not true. Others think that home prices are approaching bubble values. If we look back over the last sixteen years, that is also not the case. As a matter of fact, the numbers show that the U.S. residential real estate market is doing just fine.

Here are two articles and excerpts that make this point:

The Housing Market Is Finally Starting to Look HealthyThe NY Times

It has been an excruciatingly long time coming, but the housing sector in the United States is finally getting healthy. Thank millennials and thank homebuilders who are starting to produce more of the starter houses young people demand.”

Why the U.S. Housing Market Is Good and Getting Even BetterThe Street

“Interest rates are so low now that a family can buy the median-priced U.S. home on income of less than $45,000 a year — about $11,000 less than the median household income. And half of America’s houses are cheaper than that.” 

There are those worried that all this positive talk resembles what was being said in 2004 and 2005. Jonathan Smoke, Chief Economist at realtor.com, explains the difference very simply but effectively:

“The havoc during the last cycle was the result of building too many homes and of speculation fueled by loose credit. That’s the exact opposite of what we have today.” (emphasis added)

Home Values: DEFINITELY NOT in Bubble Range

There are some industry pundits claiming that residential home values have risen too quickly and that current levels are on the verge of another housing bubble. It is easy to see how this thinking has taken form if we look at a graph of home prices from 2000 to today.

Home Values: DEFINITELY NOT in Bubble Range!! | Simplifying The Market

The graph definitely looks like a rollercoaster ride. And, as prices begin to reach 2006 levels again, it “seems logical” that the next part of the ride would be downhill. However, this graph includes the anomaly of the price bubble and the correction (the housing crash).

What if the bubble & bust didn’t occur?

Let’s assume that instead of the rise and fall in home prices that we saw last decade, we just had normal historic appreciation from 2000 to today. According to the 100+ experts that are surveyed for the Home Price Expectation Survey, normal annual appreciation for residential single family homes from 1987 to 1999 was 3.6%.

Starting with the median home price in 2000, we added 3.6% to it each year since then. Here is that graph intermixed with the above graph.

Home Values: DEFINITELY NOT in Bubble Range!! | Simplifying The Market
What this shows us is that, had the bubble and crash not occurred and instead we just had normal annual appreciation over this period, prices would actually be greater than they are today.

Bottom Line

There is no reason for alarm as prices seem to be right in line with where they should be.

How Supply & Demand Impacts the Real Estate Market

Some Highlights:

  • The Concept of Supply & Demand is a simple one. The best time to sell something is when supply of that item is low & demand for that item is high!
  • Anything under a 6-month supply is a Seller’s Market!
  • There has not been a 6-months inventory supply since August 2012!
  • Buyer Demand continues to out-pace Seller Supply!

Sales at Highest Pace in 9 Years!


Some Highlights:

  • Sales of existing homes reached the highest annual pace in over 9 years at 5.29 million.
  • Inventory remains below the 6-month norm and prices are still on the rise.
  • Interest rates are at a historic low of 3.48%.