Ogden Valley Real Estate Outlook – April 2021

Homes For Sale near Snowbasin

Ogden Valley Real Estate Market – Up, Up, Up!

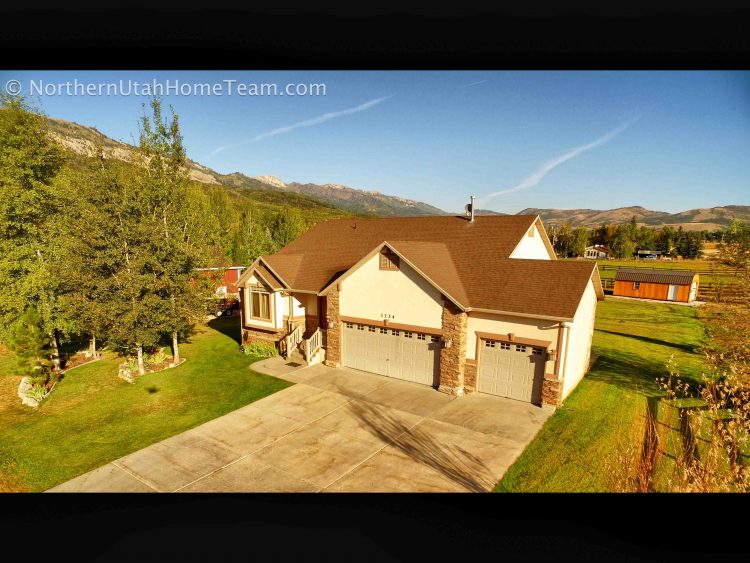
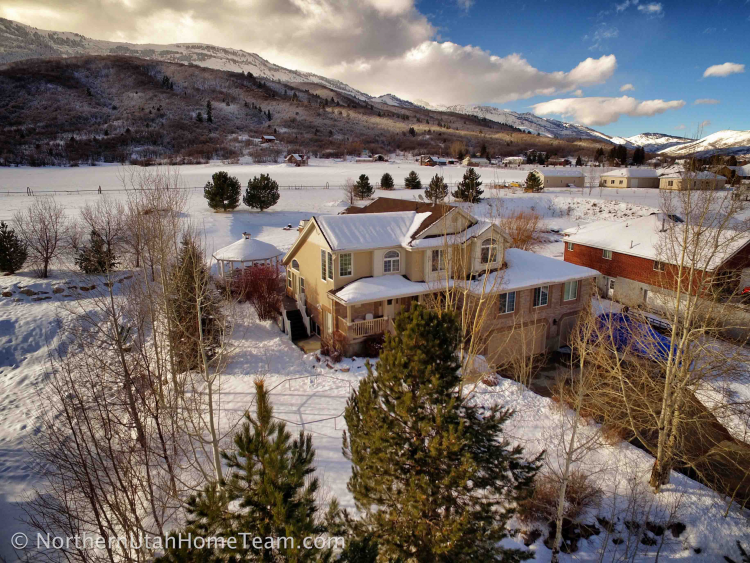
Unless you’ve been living under a rock, you won’t be surprised to learn that our valley’s real estate market is going up like we haven’t seen since prior to the last crash which lasted from 2006 to 2012. Could this be a precursor of what’s to come? Only time will tell. We need to remember that real estate goes in cycles just like the economy. Market stats/details are below. Many of our clients have decided to cash in on the recent growth (vs. following it down to a losing proposition). Is now the time for you to do the same?

For your free, no obligation equity analysis on your property, click hereWe have buyers who can’t find the right Ogden Valley property – call Joel to see if what you have might be what they want.

See What Your Neighbor’s House Sold For: www.UtahSoldHomePrices.com

Single Family1st Quarter 2021Change vs. 4th Quarter 20201st Quarter 2020Last 12 Months Change
Available Inventory20 (1.2 month)-43%59 (3.9 mos)-66%
Sold28-44%2433%
Avg.Days on Market30-39%138-47%
Median Sold Price$804,5009%$599,30018%

To learn how our Ultimate 57-Point Marketing Plan is earning our sellers about 4% more and selling in ½ the time (compared to the average agent), click here or just give us a call.

This report is developed quarterly and is based on information from Wasatch Front Regional MLS for the period stated above.

Ogden Valley Real Estate Outlook – January 2021

Homes For Sale near Snowbasin

Ogden Valley Real Estate Market – A Mixed Bag

It should be no surprise to you that our little valley’s real estate market has been seeing the same trends lately as the rest of the state and most parts of the country. Houses are selling faster and at higher prices. Demand is high (COVID being just one of the factors) and supply is low (who wants to move out of our valley, especially during COVID, right?). All of these factors have led to the results you can see below.

For your free, no obligation equity analysis on your property, click hereWe have buyers who can’t find the right Ogden Valley property – call Joel to see if what you have might be what they want.

See What Your Neighbor’s House Sold For: www.UtahSoldHomePrices.com

.

Featured Valley Listing: Click the photo for details, more photos, aerial video and walking tour video

Single Family4th Quarter 2020Change vs. 3rd Quarter 20204th Quarter 2019Last 12 Months Change
Available Inventory35 (1 month)0%53 (3.3 mos)-34%
Sold50-25%3440%
Avg.Days on Market5046%92-26%
Median Sold Price$737,60016%$536,80015%

To learn how our Ultimate 57-Point Marketing Plan is earning our sellers about 4% more and selling in ½ the time (compared to the average agent), click here or just give us a call.

This report is developed quarterly and is based on information from Wasatch Front Regional MLS for the period stated above.

Ogden Valley Real Estate Outlook – April 2020

Homes For Sale near Snowbasin

Ogden Valley Real Estate Market – Big Gains; Now What?

Wow, what a quarter and year! Prices saw double digit percentage increases during the 1st quarter of 2020 and also over the last 12 months. More details are below. But now what? What’s the short- and medium-term future to bring as a result of these times of health and economic uncertainty? No one knows for certain, but most experts are expecting an economic and real estate slowdown. Many of our clients have decided to cash in on the recent growth (vs. following it down to a losing proposition). Is now the time or you to do the same?

For your free, no obligation equity analysis on your property, click hereWe have buyers who can’t find the right Ogden Valley property – call Joel to see if what you have might be what they want.

See What Your Neighbor’s House Sold For: www.UtahSoldHomePrices.com

.

Featured Valley Listing: Click the photo for details, more photos, aerial video and walking tour video

Single Family1st Quarter 2020Change vs. 4th Quarter 20191st Quarter 2019Last 12 Months Change
Available Inventory59 (3.9 mos)11%72 (5.6 mos)-18%
Sold24-29%1513%
Avg.Days on Market13850%172-12%
Median Sold Price$599,30012%$503,90016%

To learn how our Ultimate 57-Point Marketing Plan is earning our sellers about 4% more and selling in ½ the time (compared to the average agent), click here or just give us a call.

This report is developed quarterly and is based on information from Wasatch Front Regional MLS for the period stated above.

Ogden Valley Real Estate Outlook – January 2020

Homes For Sale near Snowbasin

Ogden Valley Real Estate Market – A Mixed Bag

You may recall that quarter 2 of 2019 saw strong improvements in the market, while quarter 3 was a mix bag of results. The 4th quarter continued with mixed results as can be typical with a pre-holiday slowdown. Properties continue to sell quickly (about 3 months) when priced correctly. Fewer people want to leave our valley (not a surprise) so inventory was down substantially. Values were slightly down from the prior quarter, but up over the last 12 months. All of the details are below.

For your free, no obligation equity analysis on your property, click hereWe have buyers who can’t find the right Ogden Valley property – call Joel to see if what you have might be what they want.

See What Your Neighbor’s House Sold For: www.UtahSoldHomePrices.com

.

Featured Valley Listing: Click the photo for details, more photos, aerial video and walking tour video

Single Family4th Quarter 2019Change vs. 3rd Quarter 20194th Quarter 2018Last 12 Months Change
Available Inventory53 (3.3 mos)-28%74 (7.5 mos)-28%
Sold33-11%26-5%
Avg.Days on Market91-6%7717%
Median Sold Price$533,900-3%$517,50017%

To learn how our Ultimate 57-Point Marketing Plan is earning our sellers about 4% more and selling in ½ the time (compared to the average agent), click here or just give us a call.

This report is developed quarterly and is based on information from Wasatch Front Regional MLS for the period stated above.

Ogden Valley Real Estate Outlook – October 2019

Homes For Sale near Snowbasin

Ogden Valley Real Estate Market – A Mixed Bag

This last quarter shows mixed results. All of the details are below.

What’s up?

  • The year to date median sales price
  • Third quarter 2019 median sales price (compared to last year’s Q3)


What’s down?

  • 2019 median sales price third quarter compared to second quarter
  • The number of homes sold decreased.


For your free, no obligation equity analysis on your property, click hereWe have buyers who can’t find the right Ogden Valley property – call Joel to see if what you have might be what they want.

See What Your Neighbor’s House Sold For: www.UtahSoldHomePrices.com

.

Featured Valley Listing: Click the photo for details, more photos, aerial video and walking tour video

Single Family3rd Quarter 2019Change vs. 2nd Quarter 20193rd Quarter 2018Last 12 Months Change
Available Inventory74 (3.8 mos)-9%74 (4.2 mos)0%
Sold3716%38-14%
Avg.Days on Market9733%79-1%
Median Sold Price$568,300-8%$511,00018%

To learn how our Ultimate 57-Point Marketing Plan is earning our sellers about 4% more and selling in ½ the time (compared to the average agent), click here or just give us a call.

This report is developed quarterly and is based on information from Wasatch Front Regional MLS for the period stated above.

Ogden Valley Real Estate Outlook – July 2019

Homes For Sale near Snowbasin

Ogden Valley Real Estate Market – Big Increases

Values have increased substantially in our valley when comparing this quarter to the prior quarter (and also compared to the last 12 months). The average days on market has also shortened. We find it interesting this is happening with an increase in available inventory so we’ll see how that effects the rest of 2019. All of the details are below.

For your free, no obligation equity analysis on your property, click hereWe have buyers who can’t find the right Ogden Valley property – call Joel to see if what you have might be what they want.

See What Your Neighbor’s House Sold For: www.UtahSoldHomePrices.com

.

Featured Valley Listing (Price Drop!): Click the photo for details, more photos, aerial video and walking tour video

Single Family1st Quarter 2019Change vs. 4th Quarter 20181st Quarter 2018Last 12 Months Change
Available Inventory81 (11.1 mos)13%67 (3.0 mos)21%
Sold32113%33-11%
Avg.Days on Market73-58%126-7%
Median Sold Price$620,90023%$463,40018%

To learn how our Ultimate 57-Point Marketing Plan is earning our sellers about 4% more and selling in ½ the time (compared to the average agent), click here or just give us a call.

This report is developed quarterly and is based on information from Wasatch Front Regional MLS for the period stated above.

Ogden Valley Real Estate Outlook – April 2019

Homes For Sale near Snowbasin

Ogden Valley Real Estate Market – Big Slow Down

Although prices this quarter only fell by 3%, the most notable market indicator of a slow down was the more than doubling of the average Days on Market (to almost 6 months). This is a fairly strong buyers market overall. Year-over-year numbers look good showing a 7% increase in values, fueled entirely by a strong first half of 2018. All of the details are below.

For your free, no obligation equity analysis on your property, click hereWe have buyers who can’t find the right Ogden Valley property – call Joel to see if what you have might be what they want.

See What Your Neighbor’s House Sold For: www.UtahSoldHomePrices.com

.

Featured Valley Listing: Click the photo for details, more photos, aerial video and walking tour video

Ogden Valley 5 Acre Lot For Sale

Single Family1st Quarter 2019Change vs. 4th Quarter 20181st Quarter 2018Last 12 Months Change
Available Inventory72 (5.6 mos)-3%74 (4.5 mos)-3%
Sold15-42%26-10%
Avg.Days on Market172124%8912%
Median Sold Price$503,900-3%$449,4007%

To learn how our Ultimate 57-Point Marketing Plan is earning our sellers about 4% more and selling in ½ the time (compared to the average agent), click here or just give us a call.

This report is developed quarterly and is based on information from Wasatch Front Regional MLS for the period stated above.

Ogden Valley Real Estate Outlook – January 2019

Homes For Sale near Snowbasin

Ogden Valley Real Estate Market – Flat Yet Again

You may recall that quarter 3 of 2018 saw strong improvements in the market after 3 quarters of little growth. The 4th quarter seems to be back on the same flat pace with little/no growth in in the valley. Fewer sales and almost 3 months of inventory. Year-over-year prices have shown a slight (4%) increase. All of the details are below.

For your free, no obligation equity analysis on your property, click hereWe have buyers who can’t find the right Ogden Valley property – call Joel to see if what you have might be what they want.

See What Your Neighbor’s House Sold For: www.UtahSoldHomePrices.com

.

Featured Valley Listing: Click the photo for details, more photos, aerial video and walking tour video

Ogden Valley Home for Sale

Single Family4th Quarter 2018Change vs. 3rd Quarter 20184th Quarter 2017Last 12 Months Change
Available Inventory74 (7.5 mos)0%83 (4.7 mos)-11%
Sold25-34%312%
Avg.Days on Market782%128-20%
Median Sold Price$511,8000%$475,8004%

To learn how our Ultimate 57-Point Marketing Plan is earning our sellers about 4% more and selling in ½ the time (compared to the average agent), click here or just give us a call.

This report is developed quarterly and is based on information from Wasatch Front Regional MLS for the period stated above.

Ogden Valley Real Estate Outlook – October 2018

Homes For Sale near Snowbasin

Ogden Valley Real Estate Market – Big Quarter

We saw very positive changes this quarter with big increases in prices, reduced days on market, and an increase in properties sold. This makes up for a poor 2nd half of quarter #2. Year over year changes show a modest improvement. This is not even close to what has been happening on the Wasatch Front, but it is trending in the right direction. All of the details are below.

For your free, no obligation equity analysis on your property, click hereWe have buyers who can’t find the right Ogden Valley property – call Joel to see if what you have might be what they want.

See What Your Neighbor’s House Sold For: www.UtahSoldHomePrices.com

.

Featured Valley Listing: Click the photo for details, more photos, aerial video and walking tour video

Ogden Valley 5 Acre Lot For Sale

Single Family3rd Quarter 2018Change vs. 2nd Quarter 20183rd Quarter 2017Last 12 Months Change
Available Inventory74 (4.2 mos)10%88 (4.7 mos)-16%
Sold3815%357%
Avg.Days on Market79-37%86-1%
Median Sold Price$511,00010%$445,7004%

To learn how our Ultimate 57-Point Marketing Plan is earning our sellers about 4% more and selling in ½ the time (compared to the average agent), click here or just give us a call.

This report is developed quarterly and is based on information from Wasatch Front Regional MLS for the period stated above.

Ogden Valley Real Estate Outlook – July 2018

Homes For Sale near Snowbasin

Ogden Valley Real Estate Market – Pretty Flat

Comparing this past quarter to the same quarter in 2017, you’ll see that although there are fewer houses for sale, prices have remained very flat. The nice little bump in prices compared to last quarter seem related to seasonal changes. Homes under $450,000, when priced correctly, are still flying off the market (large buyer demand, low inventory). All of the details are below.

For your free, no obligation equity analysis on your property, click hereWe have buyers who can’t find the right Ogden Valley property – call Joel to see if what you have might be what they want.

See What Your Neighbor’s House Sold For: www.UtahSoldHomePrices.com

.

Featured Valley Listing: Click the photo for details, more photos, aerial video and walking tour video

Green Hills Home For Sale Huntsville Utah

Single Family2nd Quarter 2018Change vs. 1st Quarter 20182nd Quarter 2017Last 12 Months Change
Available Inventory67 (3.0 mos)-9%96 (5.1 mos)-30%
Sold3223%321%
Avg.Days on Market12743%1046%
Median Sold Price$461,2003%$487,2002%

To learn how our Ultimate 57-Point Marketing Plan is earning our sellers about 4% more and selling in ½ the time (compared to the average agent), click here or just give us a call.

This report is developed quarterly and is based on information from Wasatch Front Regional MLS for the period stated above.

Ogden Valley Real Estate Outlook – April 2018

Homes For Sale near Snowbasin

Ogden Valley Real Estate Market – Pancake-like Flat

The slowing that we saw in the prior quarter has stabilized as this most recent quarter has seen prices holding fairly steady. The amount of time on the market decreased back to a more normal rate, but at 89 days can be deceiving: Properties under $400,000 continue to move fast, while over $500,000 are very slow (over a year supply). All of the details are below.

For your free, no obligation equity analysis on your property, click hereWe have buyers who can’t find the right Ogden Valley property – call Joel to see if what you have might be what they want.

See What Your Neighbor’s House Sold For: www.UtahSoldHomePrices.com

.

Featured Valley Listing: Click the photo for details, more photos, aerial video and walking tour video

Ogden Valley Home for Sale

Single Family1st Quarter 2018Change vs. 4th Quarter 20171st Quarter 2017Last 12 Months Change
Available Inventory74 (4.5 mos)-11%79 (4.9 mos)-6%
Sold26-16%271%
Avg.Days on Market89-30%148-2%
Median Sold Price$447,200-2%$470,5006%

To learn how our Ultimate 57-Point Marketing Plan is earning our sellers about 4% more and selling in ½ the time (compared to the average agent), click here or just give us a call.

This report is developed quarterly and is based on information from Wasatch Front Regional MLS for the period stated above.

Ogden Valley Real Estate Outlook – January 2018

Homes For Sale near Snowbasin

Ogden Valley Real Estate Market – Holding and Slowing

Last quarter, despite the deceiving positive statistics, we foreshadowed a slowing market in the valley. That is now reflected in this past quarter’s numbers. Although prices have held (and even show strong year-over-year increases), the time it takes for properties to sell has increased substantially. All of the details are below.

For your free, no obligation equity analysis on your property, click hereWe have buyers who can’t find the right Ogden Valley property – call Joel to see if what you have might be what they want.

See What Your Neighbor’s House Sold For: www.UtahSoldHomePrices.com

.

Featured Valley Listing: Click the photo for details, more photos, aerial video and walking tour video

Ogden Valley Townhome/Condo for Sale

Single Family4th Quarter 2017Change vs. 3rd Quarter 20174th Quarter 2016Last 12 Months Change
Available Inventory83 (4.7 mos)-6%86 (6.6 mos)-3%
Sold31-11%2611%
Avg.Days on Market12848%9013%
Median Sold Price$454,3001%$413,00010%

To learn how our Ultimate 57-Point Marketing Plan is earning our sellers about 4% more and selling in ½ the time (compared to the average agent), click here or just give us a call.

This report is developed quarterly and is based on information from Wasatch Front Regional MLS for the period stated above.

Ogden Valley Real Estate Outlook – October 2017

Homes For Sale near Snowbasin

Ogden Valley Real Estate Market – Sobering Adjustments

The statistics and details below are a little deceiving as, for the most part, they show continued market improvement. What you can’t see is that in the last 6 weeks, there has been a considerable slow down (prices and days on market). This is starting to show with the 8% sold price decline below. It will be interesting to see if this trend over the last 6 weeks continues into the 4th quarter of 2017. All of the details are below.

For your free, no obligation equity analysis on your property, click hereWe have buyers who can’t find the right Ogden Valley property – call Joel to see if what you have might be what they want.

See What Your Neighbor’s House Sold For: www.UtahSoldHomePrices.com

.

Featured Valley Listing: Click the photo for details, more photos, aerial video and walking tour video

North Fork Home For Sale Liberty Utah

Single Family3rd Quarter 2017Change vs. 2nd Quarter 20173rd Quarter 2016Last 12 Months Change
Available Inventory88 (4.7 mos)-8%111 (5.1 mos)-21%
Sold359%38-3%
Avg.Days on Market86-17%65-9%
Median Sold Price$448,200-8%$417,5008%

To learn how our Ultimate 57-Point Marketing Plan is earning our sellers about 4% more and selling in ½ the time (compared to the average agent), click here or just give us a call.

This report is developed quarterly and is based on information from Wasatch Front Regional MLS for the period stated above.

Ogden Valley Real Estate Outlook – July 2017

Homes For Sale near Snowbasin

Ogden Valley Real Estate Market – Increases Continue

Prices continue a nice steady increase this quarter, just as we’ve seen the last several quarters. Homes under $450,000, when priced correctly, are flying off the market (large buyer demand, low inventory). The rest of the market is much slower, so overall we’re experiencing a “balanced” market (neither a buyer nor seller market). All of the details are below.

For your free, no obligation equity analysis on your property, click hereWe have buyers who can’t find the right Ogden Valley property – call Joel to see if what you have might be what they want.

See What Your Neighbor’s House Sold For: www.UtahSoldHomePrices.com

.

Featured Valley Listing: Click the photo for details, more photos, aerial video and walking tour video

North Fork Home For Sale Liberty Utah

Single Family2nd Quarter 2017Change vs. 1st Quarter 20172nd Quarter 2016Last 12 Months Change
Available Inventory95 (5.1 mos)22%113 (5.5 mos)-15%
Sold3219%3212%
Avg.Days on Market104-30%114-11%
Median Sold Price$487,2004%$405,7005%

To learn how our Ultimate 57-Point Marketing Plan is earning our sellers about 4% more and selling in ½ the time (compared to the average agent), click here or just give us a call.

This report is developed quarterly and is based on information from Wasatch Front Regional MLS for the period stated above.

Ogden Valley Real Estate Outlook – April 2017

Homes For Sale near Snowbasin

Ogden Valley Real Estate Market – Sharp Increases

In general, our valley has seen (relatively) sharp price increases over the last 12 months. This has been most lead by the price segment under $450,000, which has been blistering hot (low inventories, and very short days on market). Over this price point is still lagging when compared to the Wasatch Front. Across all price points, we’re seeing a balanced market with about a 5-month supply. All of the details are below.

For your free, no obligation equity analysis on your property, click hereWe have buyers who can’t find the right Ogden Valley property – call Joel to see if what you have might be what they want.

See What Your Neighbor’s House Sold For: www.UtahSoldHomePrices.com

.

Featured Valley Listing: Click the photo for details, more photos, aerial video and walking tour video

Baily Acres, Liberty Utah, Home For Sale

Single Family1st Quarter 2017Change vs. 4th Quarter 20161st Quarter 2016Last 12 Months Change
Available Inventory79 (4.9 mos)11%71 (4.9 mos)11%
Sold274%1713%
Avg.Days on Market14863%145-22%
Median Sold Price$470,50014%$390,9009%

To learn how our Ultimate 57-Point Marketing Plan is earning our sellers about 4% more and selling in ½ the time (compared to the average agent), click here or just give us a call.

This report is developed quarterly and is based on information from Wasatch Front Regional MLS for the period stated above.

Ogden Valley Real Estate Outlook – April 2016

Homes For Sale near Snowbasin

Ogden Valley Real Estate Market – Positive Signs

Historically the 1st quarter in our Valley usually shows signs of an improving market after downturns of the 4th quarter. So these two positive signs are hopefully good news for the remainder of 2016:

  1. Single Family prices rose 13% year-to-date
  2. Number of Days on Market dropped slightly We’re also still seeing a balanced market with about a 5-month supply. All of the details are below.


For your free, no obligation equity analysis on your property, click hereWe have buyers who can’t find the right Ogden Valley property – call Joel to see if what you have might be what they want.

See What Your Neighbor’s House Sold For: www.UtahSoldHomePrices.com

.

Featured Valley Listing: Coming Soon – Call For Details (be the1st to know about it)

Single Family1st Quarter 2016Change vs. 4th Quarter 20151st Quarter 2015Last 12 Months Change
Available Inventory71 (4.9 mos)-17%98 (5.9 mos)-28%
Sold17-54%257%
Avg.Days on Market145-2%1323%
Median Sold Price$390,900-3%$354,20013%

To learn how our Ultimate 57-Point Marketing Plan is earning our sellers about 4% more and selling in ½ the time (compared to the average agent), click here or just give us a call.

This report is developed quarterly and is based on information from Wasatch Front Regional MLS for the period stated above.

Ogden Valley Real Estate Outlook – January 2016

Homes For Sale near Snowbasin

Interesting (to say the least)

Why “Interesting”? Historically, the 4th quarter is the slowest in our Valley. However, compared to the 3rd quarter of 2015, the number of sales rose over 50% while at the same time prices barely move at all. The time it took for houses to sell also increased. Year-over-year numbers show a very similar pattern. With the potential of interest rates rising in 2016, it will again be “interesting” to see how this impacts our Valley’s market.

For your free, no obligation equity analysis on your property, click hereWe have buyers who can’t find the right Ogden Valley property – call Joel to see if what you have might be what they want.

See What Your Neighbor’s House Sold For: www.UtahSoldHomePrices.com

.

Featured Valley Listing: Click the photo for details, more photos, aerial video and walking tour video

Lakeside Village Unit 17 For Sale

Single Family4th Quarter 2015Change vs. 3rd Quarter 20154th Quarter 2014Last 12 Months Change
Available Inventory86 (6.6 mos)-23%96 (6.7 mos)-10%
Sold3754%2321%
Avg.Days on Market148195%173-10%
Median Sold Price$404,700-1%$323,5000%

To learn how our Ultimate 57-Point Marketing Plan is earning our sellers about 4% more and selling in ½ the time (compared to the average agent), click here or just give us a call.

This report is developed quarterly and is based on information from Wasatch Front Regional MLS for the period stated above.

Ogden Valley Real Estate Outlook – October 2015

Homes For Sale near Snowbasin

Exciting Summer Growth

What an exciting summer! 13% price growth during the 3rd quarter (3% year-over year). Days on market also saw a big drop – so priced right, houses are selling faster. Surprisingly, inventory has remained very stable.

Still, this is not the Wasatch Front (which continued to see bigger growth). We seem to lag behind that market, so here’s hoping for continued growth over the next year for all of us in the Valley.

For your free, no obligation equity analysis on your property, click hereWe have buyers who can’t find the right Ogden Valley property – call Joel to see if what you have might be what they want.

See What Your Neighbor’s House Sold For: www.UtahSoldHomePrices.com

.

Featured Valley Listing: Click the photo for details, more photos, aerial video and walking tour video

4765E-3925N-Eden-Utah

Single Family3rd Quarter 2015Change vs. 2nd Quarter 20153rd Quarter 2014Last 12 Months Change
Available Inventory111 (5.2 mos)-2%1110%
Sold24-23%2817%
Avg.Days on Market50-73%11422%
Median Sold Price$410,50013%$350,4003%

To learn how our Ultimate 57-Point Marketing Plan is earning our sellers about 4% more and selling in ½ the time (compared to the average agent), click here or just give us a call.

This report is developed quarterly and is based on information from Wasatch Front Regional MLS for the period stated above.