Bluebird Powder Day at Powder Mountain – Mary’s Bowl; Eden Utah (Ogden Valley)

Just a little taste of what it’s like living so close to the mountain paradise called Powder Mountain.

For a list of homes for sale in the Ogden Valley, visit: OgdenValleyUtah.NorthernUtahHomeTeam.com

For more information about the Ogden Valley, visit: liveogdenvalleyutah.com

Tour of Utah 2019 – Scenes from the Road, Stage 2; Ogden Valley Utah

Just having a little fun out watching the Tour Of Utah rolling through our amazing Ogden Valley.

For a list of homes for sale in the Ogden Valley, visit: OgdenValleyUtah.NorthernUtahHomeTeam.com

For more information about the Ogden Valley, visit: liveogdenvalleyutah.com

‘Old Millennials’ Are Diving Head-First into Homeownership

‘Old Millennials’ Are Diving Head-First into Homeownership [INFOGRAPHIC] | Simplifying The Market

Some Highlights:

  • ‘Old Millennials’ are defined as 25-36 year olds according to the US Census Bureau.
  • According to NAR’s latest Profile of Home Buyers & Sellers, the median age of all first-time home buyers is 31 years old.
  • More and more ‘Old Millennials’ are realizing that homeownership is within their reach now!

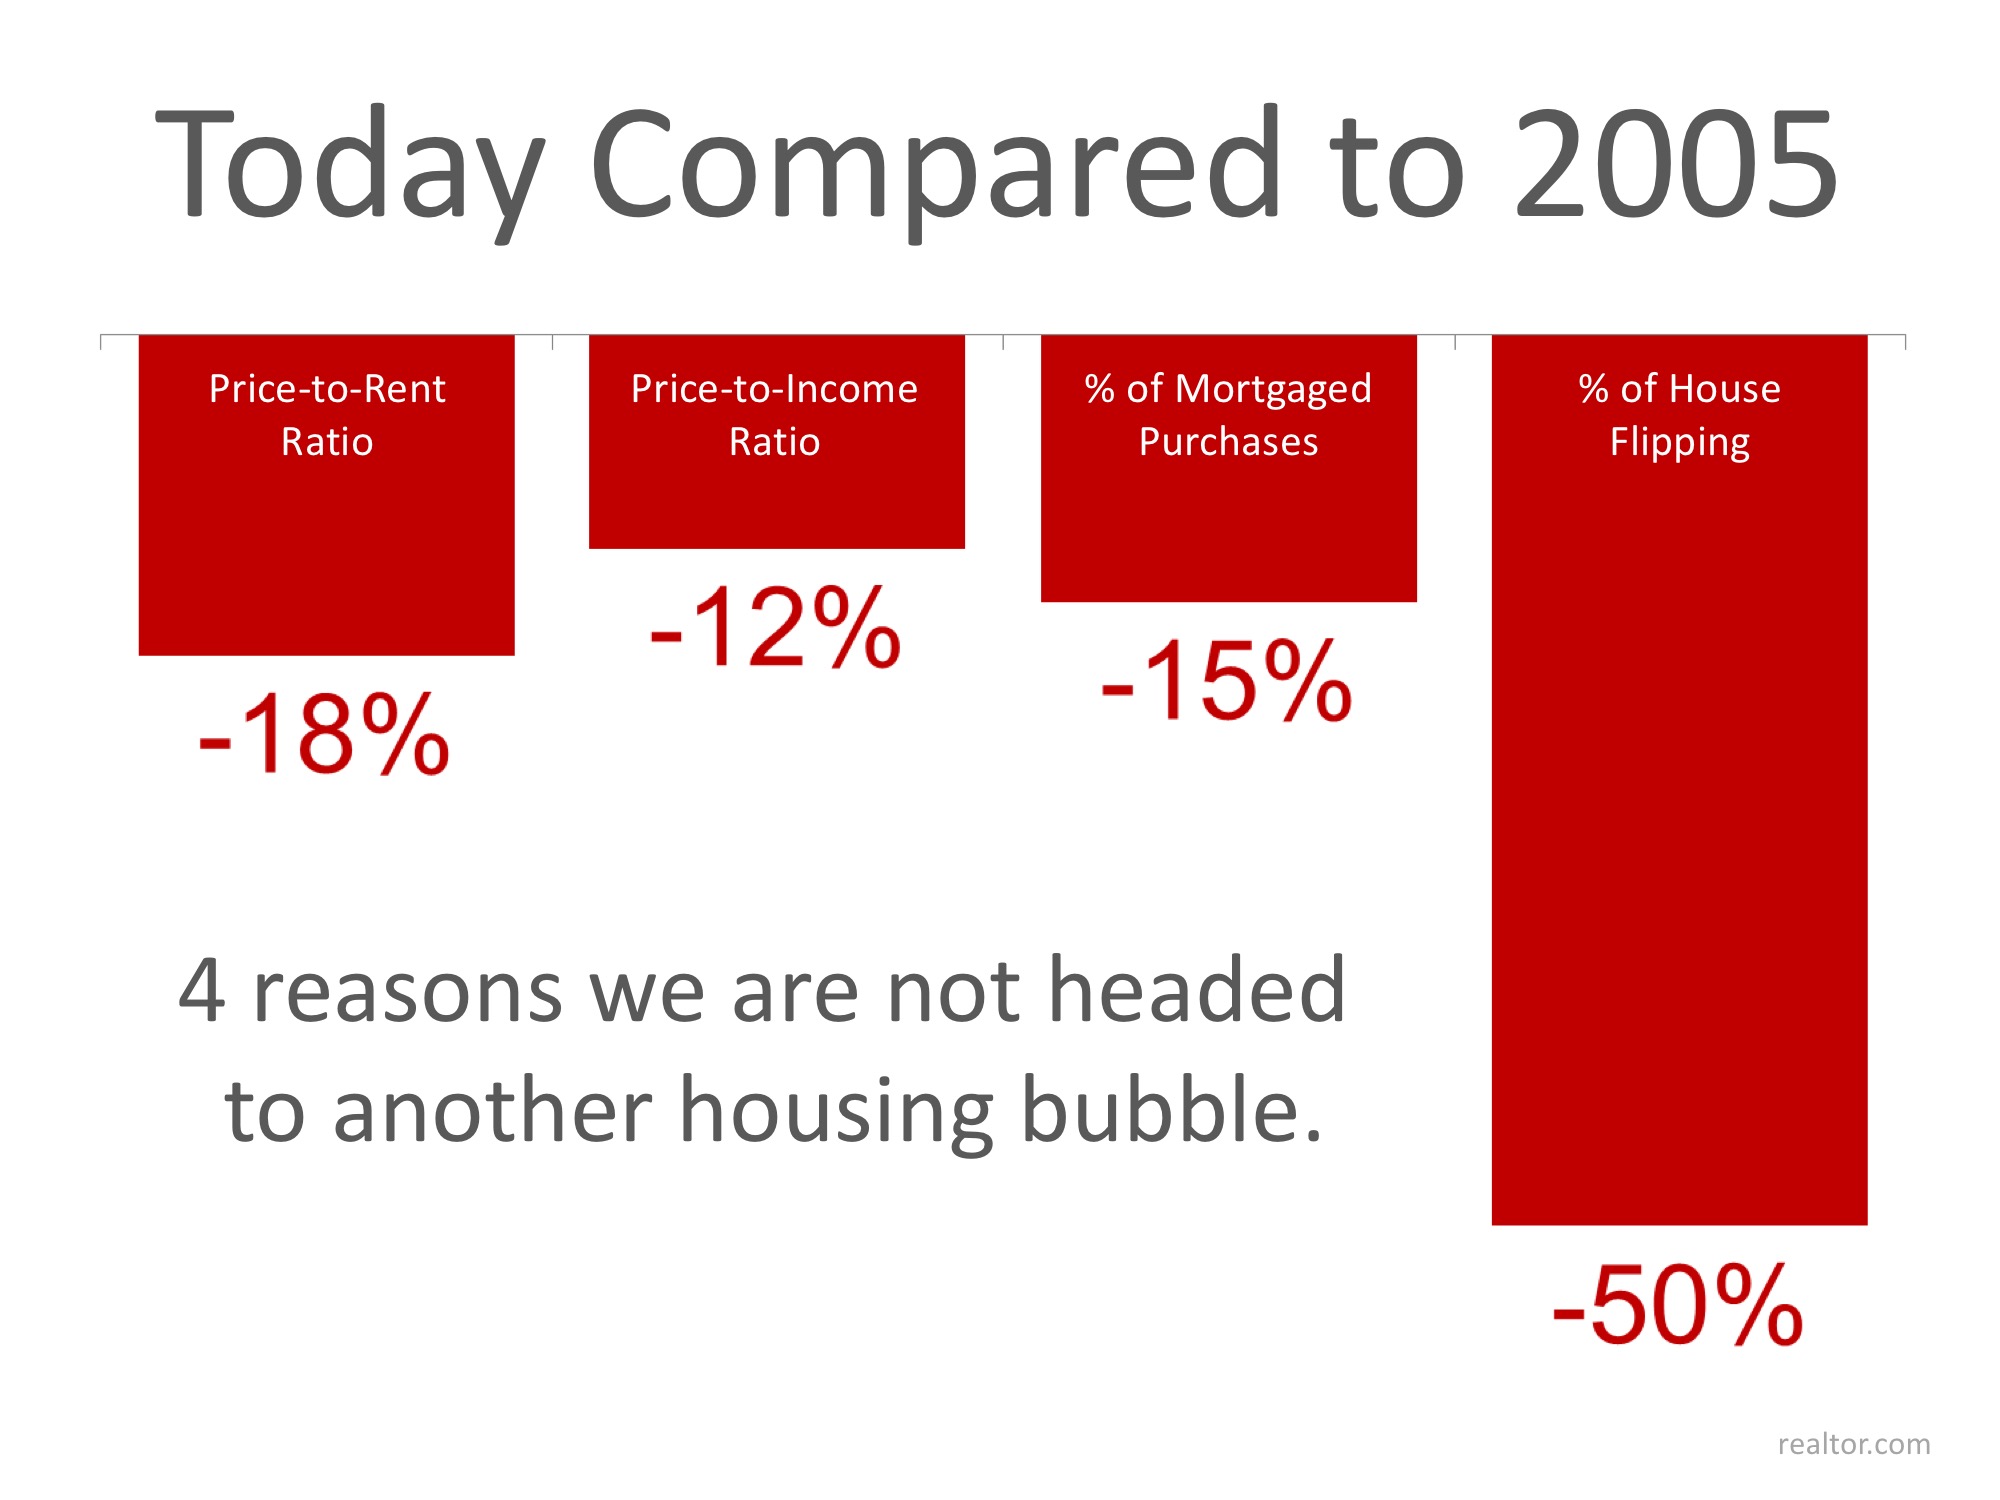
4 Stats That PROVE This Is NOT 2005 All over Again

Recent research by the National Association of Realtors (NAR) examined certain red flags that caused the housing crisis in 2005, and then compared them to today’s real estate market. Today, we want to concentrate on four of those red flags.

  1. Price to Rent Ratio
  2. Price to Income Ratio
  3. Mortgage Transactions
  4. House Flipping

All four categories were outside historical norms in 2005. Home prices were way above normal ratios when compared to both rents and incomes at the time.

NAR explained that mortgage transactions as a percentage of all home sales were also at a higher percentage:

“Loose credit was one of the main culprits of the housing crisis. Mortgage lending expanded dramatically as unhealthy housing speculation reached its peak and was met by the highest level of credit availability as measured by the Mortgage Bankers Association. The index measures the overall mortgage credit condition by the share of home sales financed by mortgages. This metric does not capture credit quality, but it does set a view of the importance of financing in supporting the housing market.”

House flipping was rampant in 2005. As NAR’s research points out:

“Heightened flipping activity is a clear indication of speculation in the real estate market. A property is considered as a speculative flip if the property is sold twice within 12 months and with positive profit. Flipping is a normal part of a healthy housing market. In an inflated housing market, expectations about short-term profit from pure price appreciation are very high; therefore, the level of flipping activity would show evidence of being heightened.”

Here are the categories with percentages reflecting the unrealistic ratios & numbers of 2005 as compared to the current market. Remember, a negative percentage reflects a positive gain for the market.

4 Stats That PROVE This Is NOT 2005 All over Again | Simplifying The Market

Bottom Line

They say hindsight is 20/20… Today, experts are keeping a close watch on the potential red flags that went unnoticed in 2005.

Real Life vs. Reality TV: 5 Myths Explained

Have you ever been flipping through the channels, only to find yourself glued to the couch in an HGTV ‘show hole’*? We’ve all been there… watching entire seasons of “Love it or List it,” “Fixer Upper,” “House Hunters,” “Flip or Flop,” “Property Brothers,” and so many more, just in one sitting.  

When you’re in the middle of your real estate themed show marathon, you might start to think that everything you see on TV must be how it works in real life, but you may need a reality check.

Reality TV Show Myths vs. Real Life:

Myth #1: Buyers look at 3 homes and make a decision to purchase one of them.

Truth: There may be buyers who fall in love and buy the first home they see, but more often than not the process of buying a home means touring more than three homes.

Myth #2: The houses the buyers are touring are still for sale.

Truth: The reality is being staged for TV. Many of the homes being shown are already sold and are off the market.

Myth #3: The buyers haven’t made a purchase decision yet.

Truth: Since there is no way to show the entire buying process in a 30-minute show, TV producers often choose buyers who are further along in the process and have already chosen a home to buy.

Myth #4: If you list your home for sale, it will ALWAYS sell at the Open House.

Truth: Of course this would be great! Open Houses are important to guarantee the most exposure to buyers in your area, but are only a PIECE of the overall marketing of your home. Just realize that many homes are sold during regular listing appointments as well. 

Myth #5: Homeowners make a decision about selling their home after a 5-minute conversation.

Truth: Similar to the buyers portrayed on the shows, many of the sellers have already spent hours deliberating the decision to list their home and move on with their life/goals.

Bottom Line

Having an experienced professional on your side while navigating the real estate market is the best way to guarantee that you can make the home of your dreams a reality!

*Show Hole – A side effect of binge-watching. Symptoms include a sense of emptiness and depression brought on by realizing you just wasted a good portion of your life watching several seasons of a TV show or an entire movie franchise all at once when you could have managed your time better.

How Do Rising Prices Impact Your Home Equity?

Yesterday, we shared the results of the latest Home Price Expectation Survey by Pulsenomics. One of the big takeaways from the survey is that over the next five years, home prices will appreciate 3.5% per year on average, and cumulatively will grow by around 18%.

So what does this mean for homeowners and their equity position?

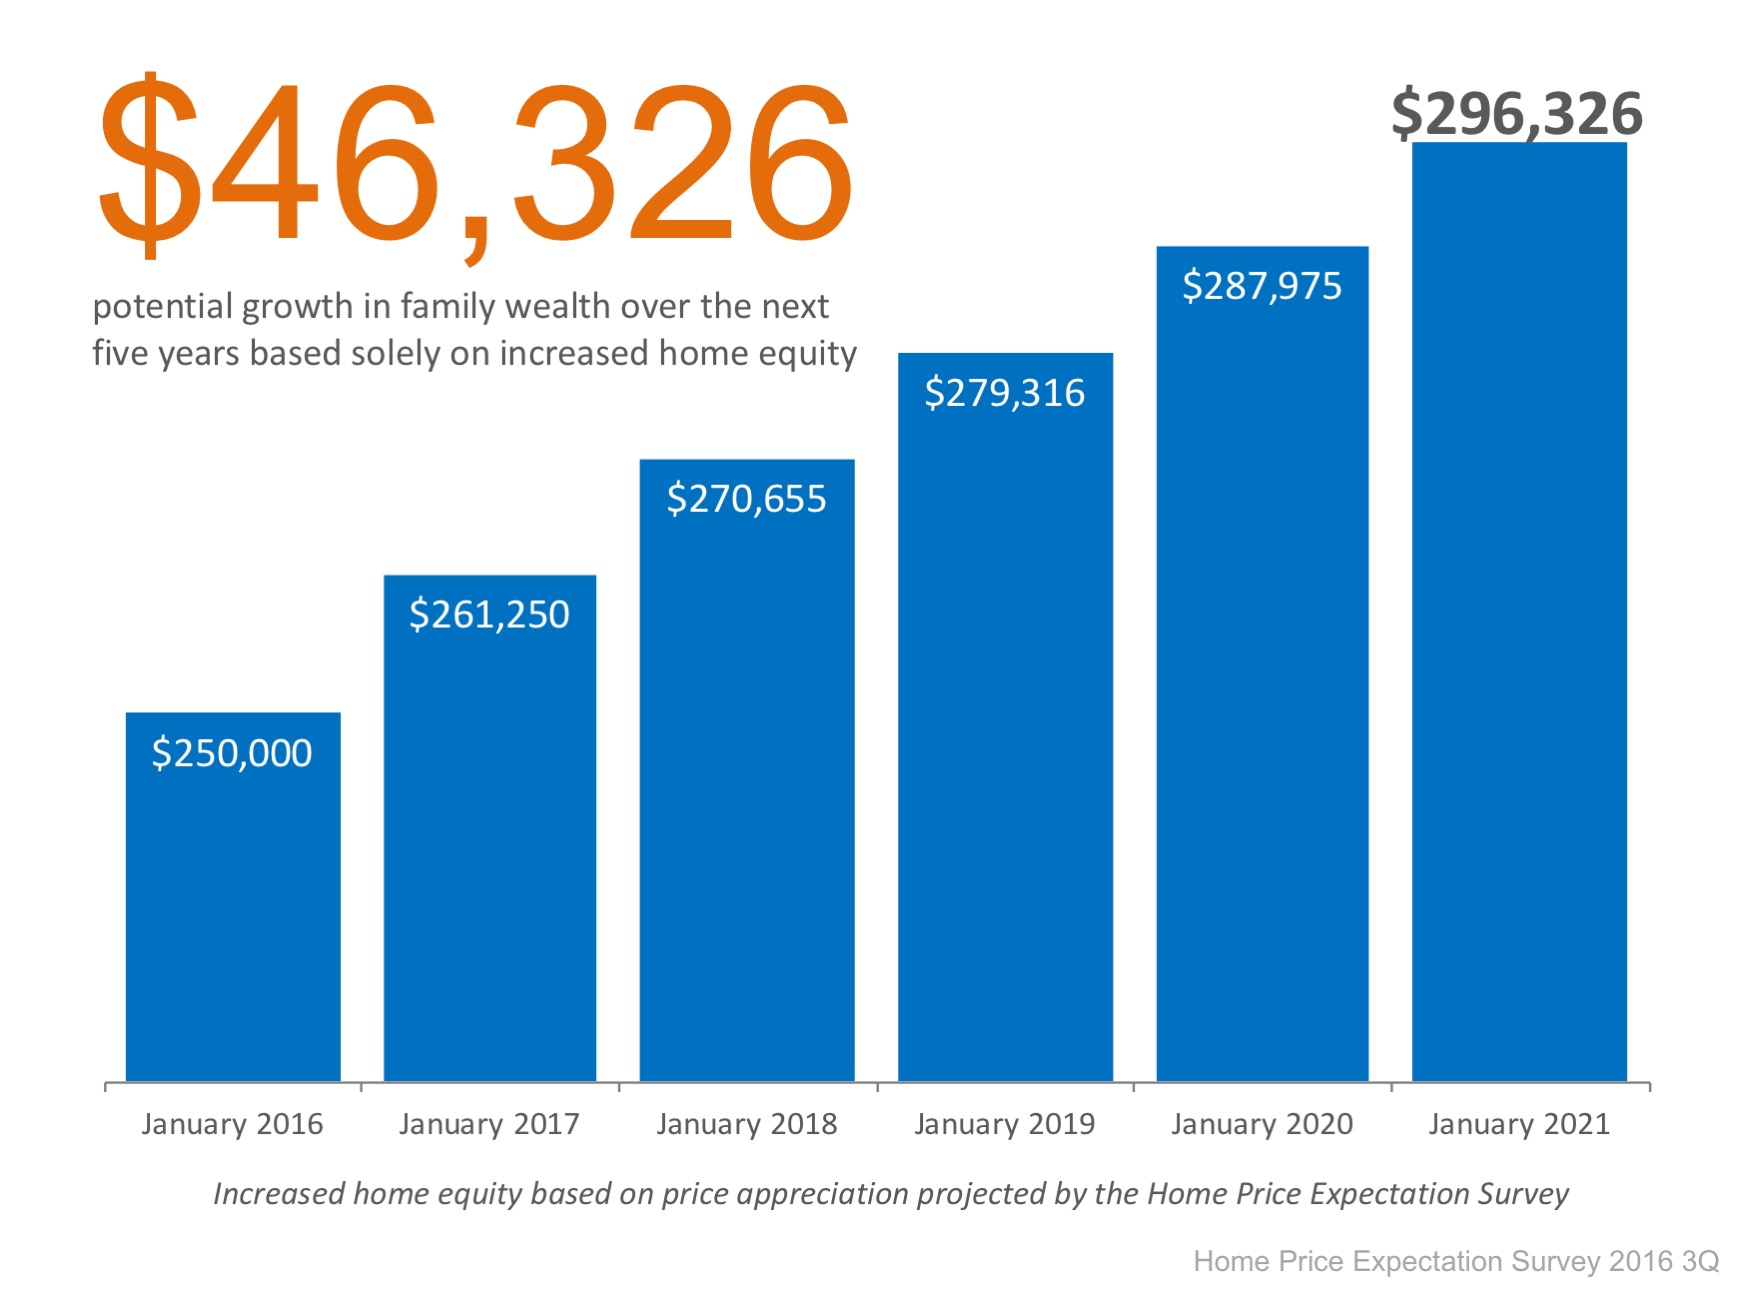
For example, let’s assume a young couple purchased and closed on a $250,000 home in January of this year. If we only look at the projected increase in the price of that home, how much equity would they earn over the next 5 years?

How Do Rising Prices Impact Your Home Equity? | Simplifying The Market

Since the experts predict that home prices will increase by 4.5% this year alone, the young homeowners will have gained over $11,000 in equity in just one year.

Over a five-year period, their equity will increase by over $46,000! This figure does not even take into account their monthly principal mortgage payments. In many cases, home equity is one of the largest portions of a family’s overall net worth.

Bottom Line

Not only is homeownership something to be proud of, it also offers you and your family the ability to build equity you can borrow against in the future. If you are ready and willing to buy, let’s meet up to find out if you are able to today!

Where Are Home Prices Headed Over the Next 5 Years?

Today, many real estate conversations center on housing prices and where they may be headed. That is why we like the Home Price Expectation Survey.

Every quarter, Pulsenomics surveys a nationwide panel of over one hundred economists, real estate experts, and investment & market strategists about where they believe prices are headed over the next five years. They then average the projections of all 100+ experts into a single number.

The results of their latest survey:

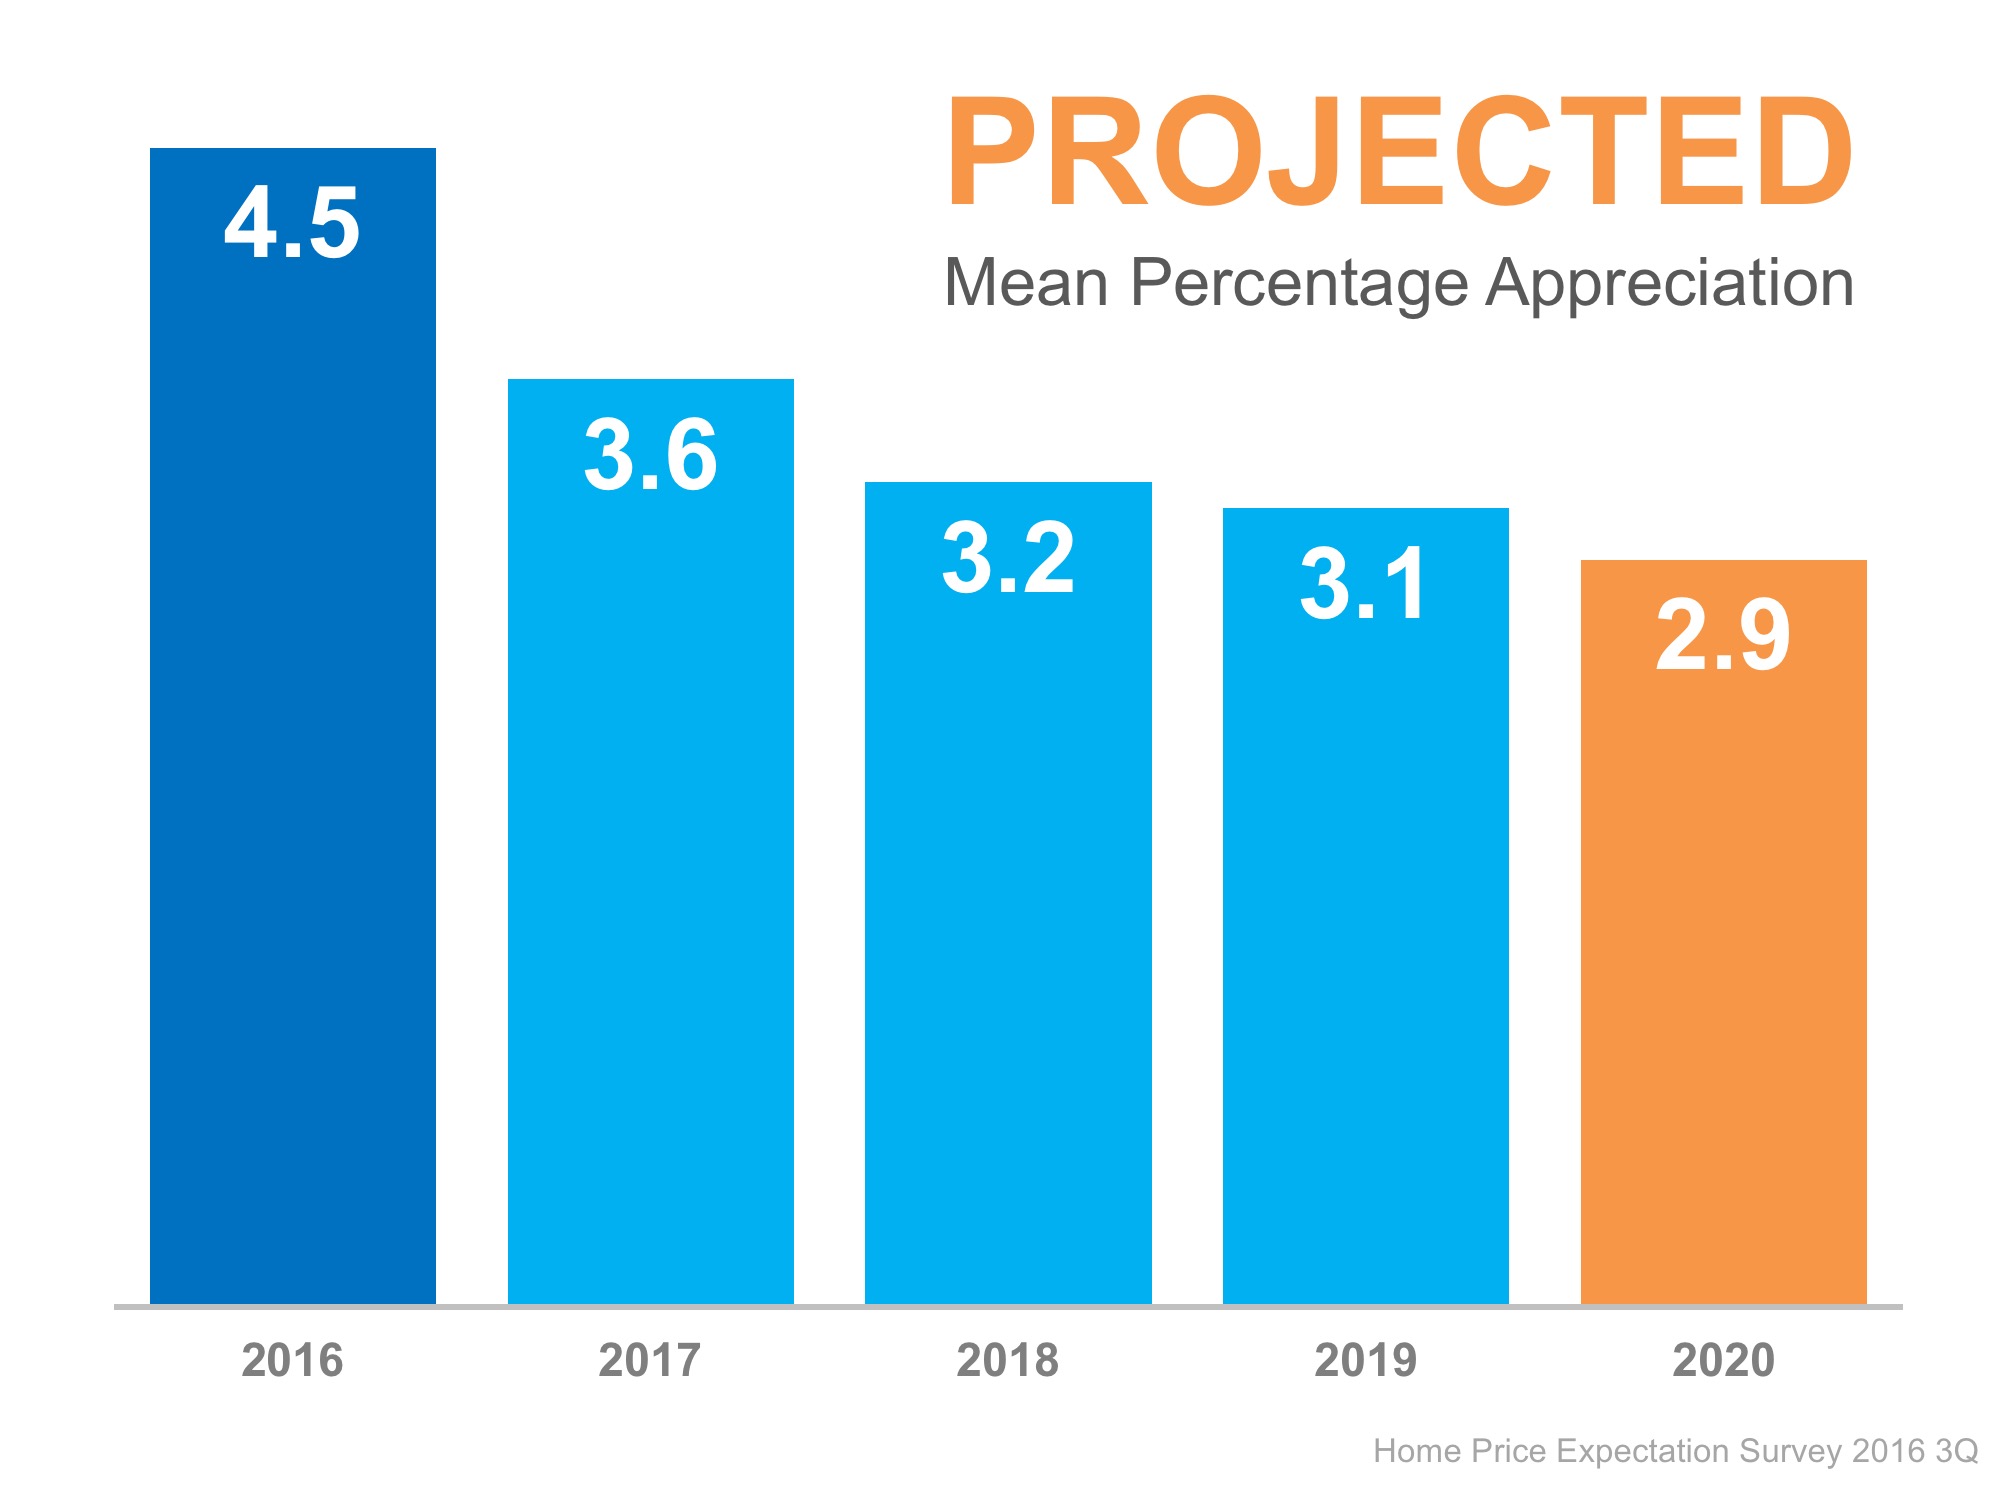
Home values will appreciate by 4.5% over the course of 2016, 3.6% in 2017 and about 3.2% in the next two years, and finally 2.9% in 2020 (as shown below). That means the average annual appreciation will be 3.5% over the next 5 years.

Projected Appreciation | Simplifying The Market

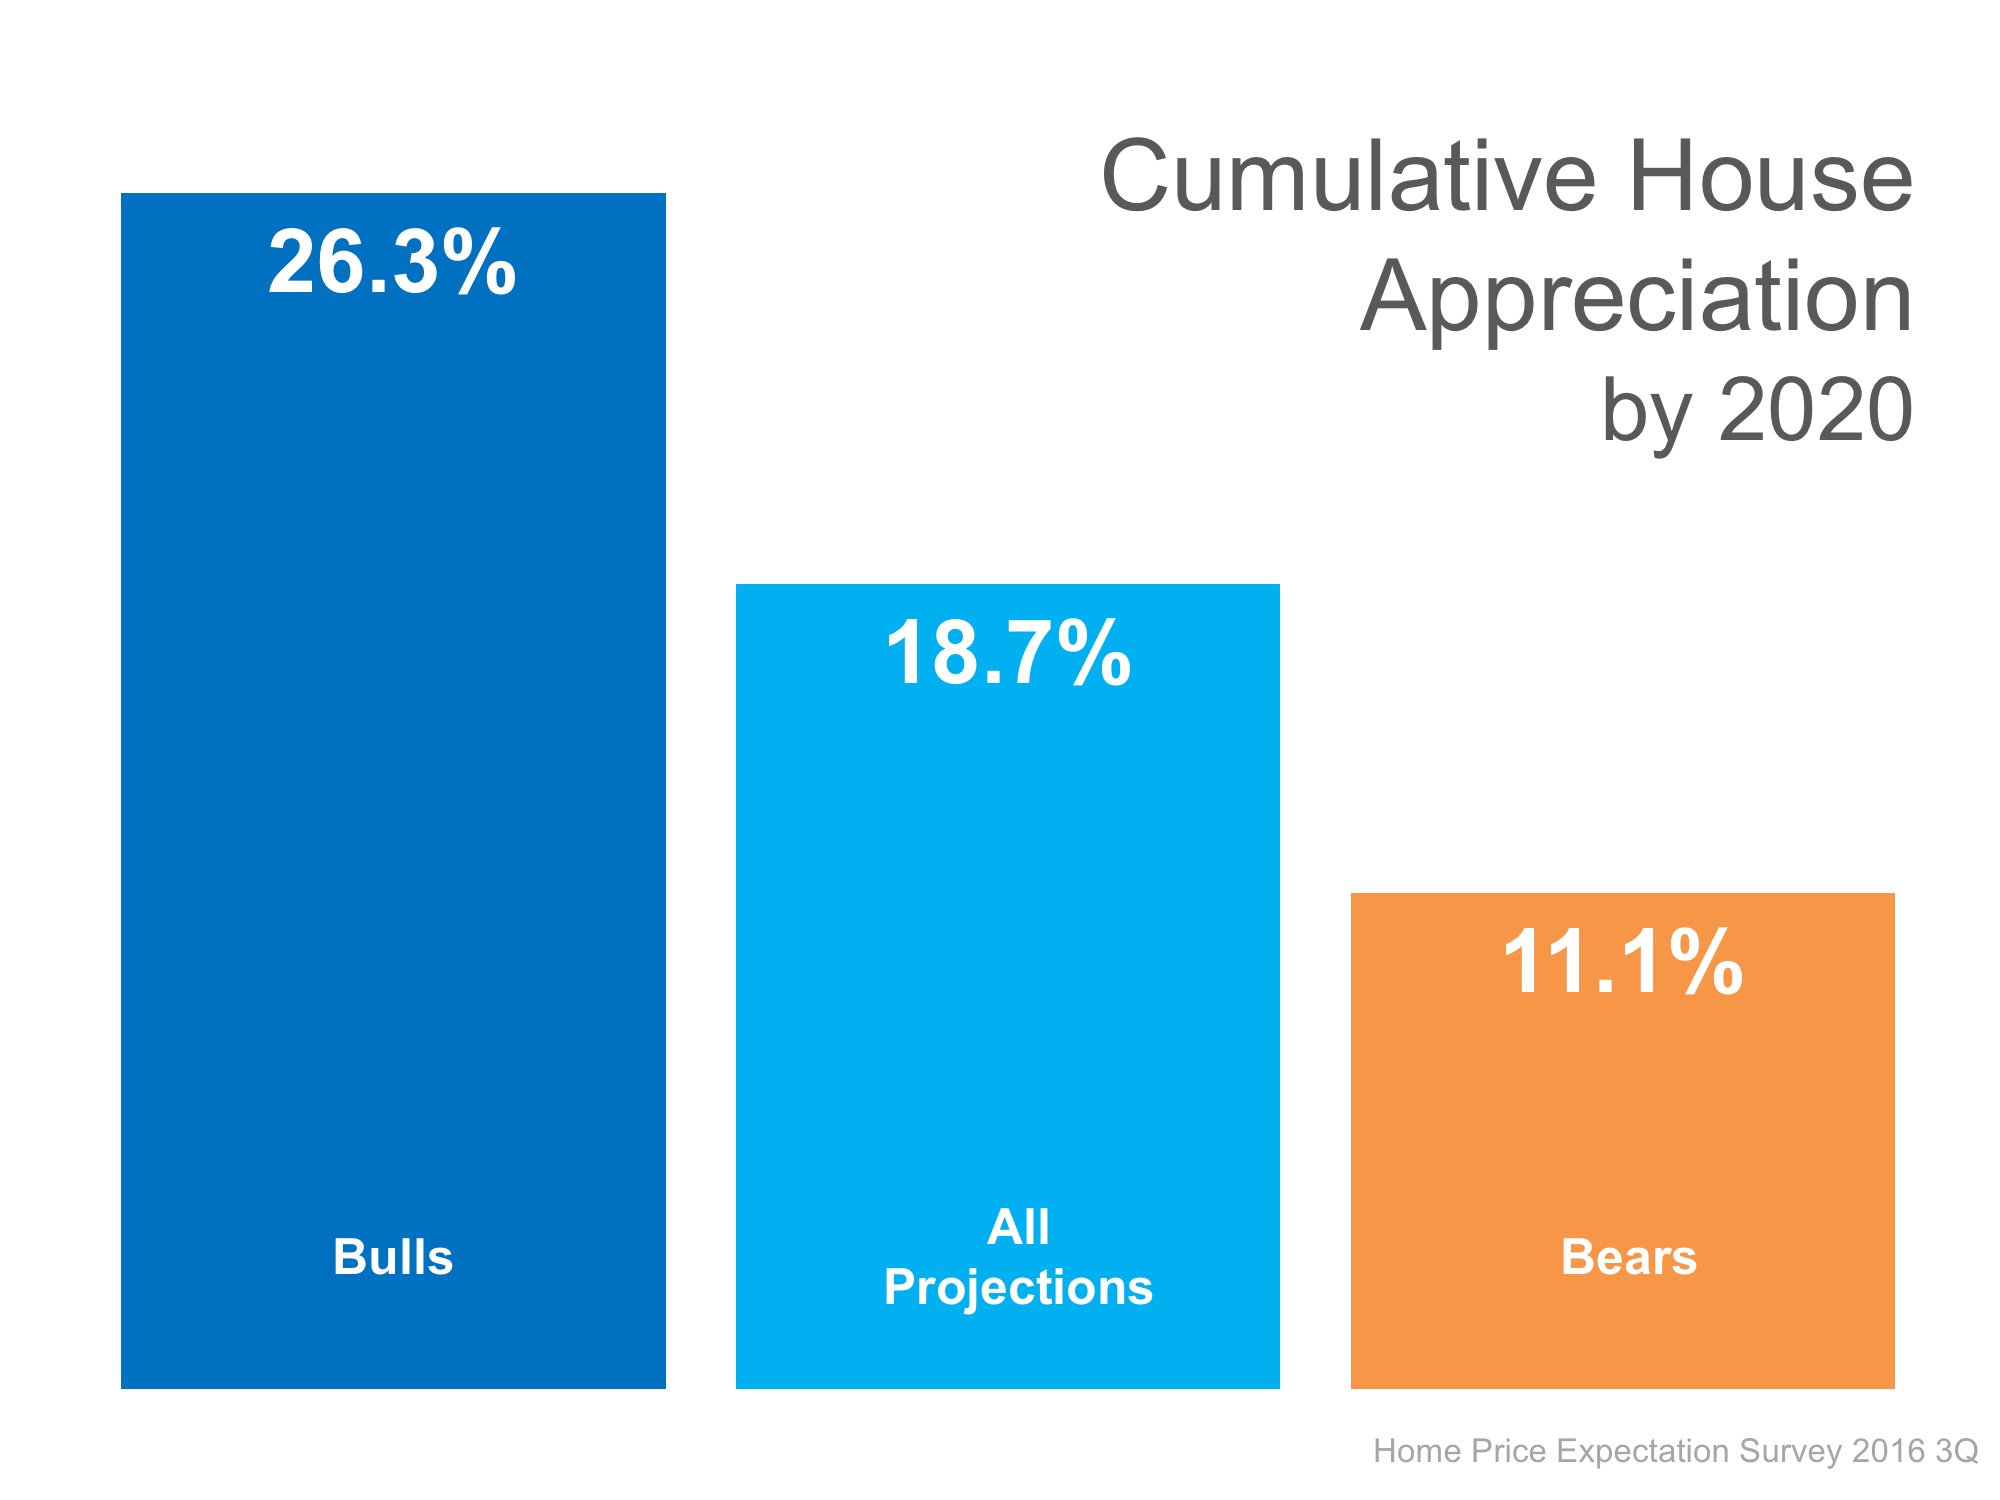
The prediction for cumulative appreciation increased slightly from 24.7% to 26.3% by 2020. The experts making up the most bearish quartile of the survey are still projecting a cumulative appreciation of 11.1%.

Cumulative Price Appreciation | Simplifying The Market

Bottom Line

Individual opinions make headlines. We believe the survey is a fairer depiction of future values.

Luxury Home Sales & the Impact of the Stock Market

In a recent post, CoreLogic looked at the correlation between stocks and the sales of upper-end properties ($1 Million+ sales price – luxury home sales). The report revealed:

 “The powerful ‘wealth effects’ generated by the rapid rise in equities between 2009 and 2015 drove a large rise in the sales of homes that sold for $1 million or more.

Historically, sales of homes priced $1 million or more averaged 1.2 percent of all home sales. The spread between high-end sales and equities widened during the housing bubble but then moved more closely in unison. By the time the equity markets had peaked in May 2015, the $1 million or more share of the market had nearly doubled, averaging 2.2 percent for the remainder of the year.”

This makes sense. As people see their wealth increasing, they feel more confident in their purchasing power. And, of course, that would also impact their decisions regarding real estate. The stock market dipped earlier this year and there was quite a bit of anecdotal evidence that the upper-end market was beginning to soften.

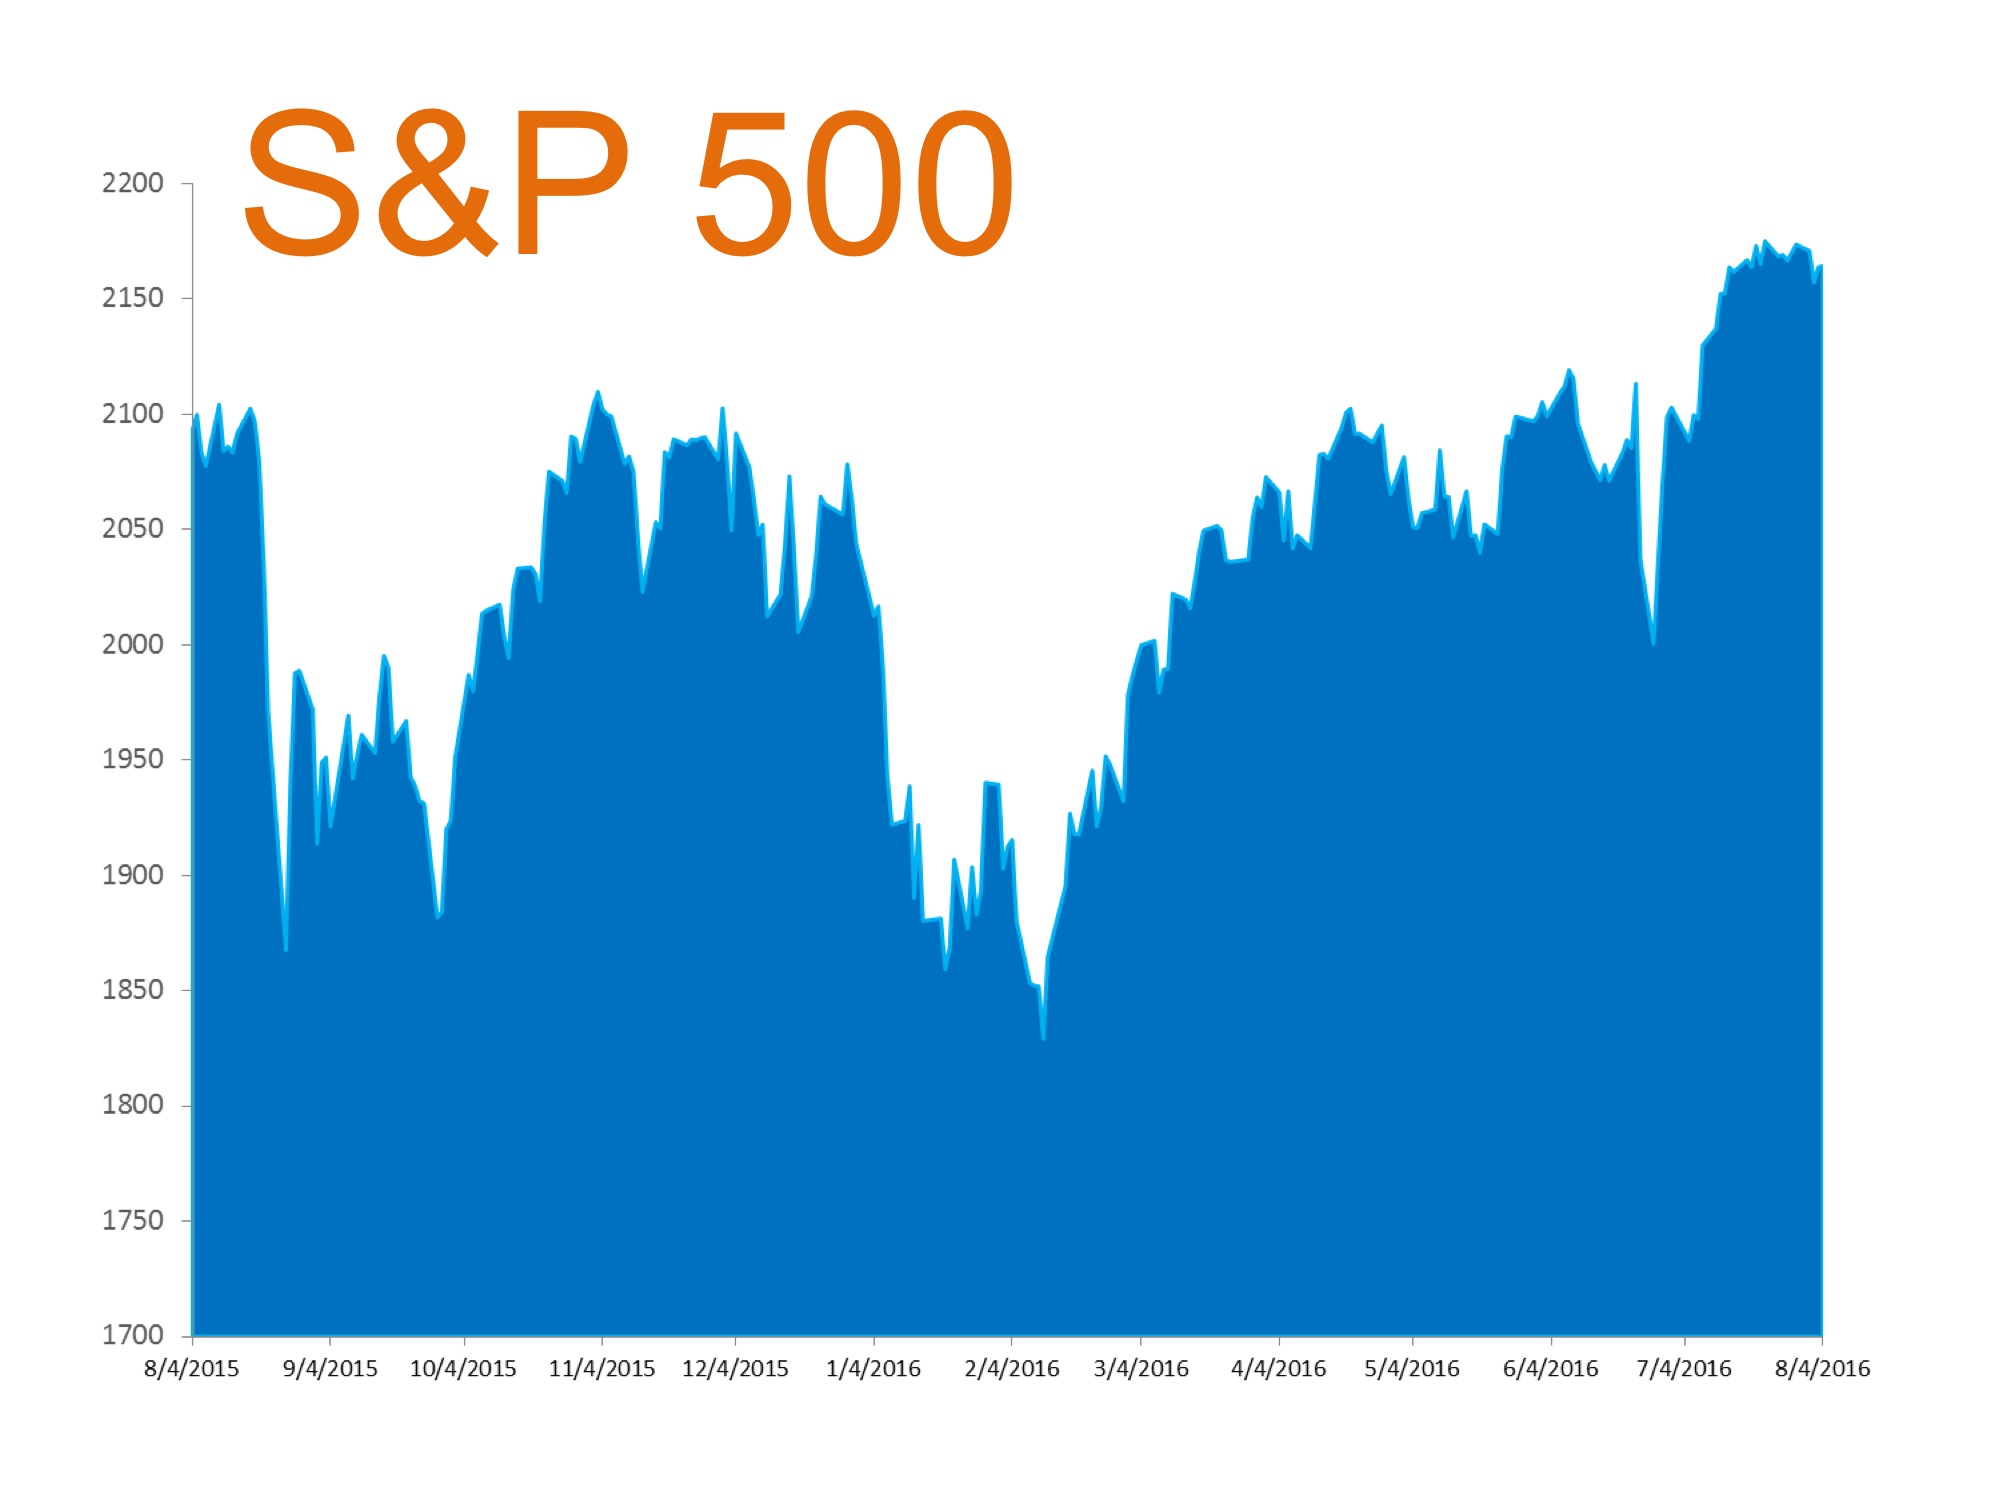
As we can see in the chart below, the market is again flourishing. That may rejuvenate the luxury market as we move through the rest of the year.

Luxury Home Sales & the Impact of the Stock Market | Simplifying The Market

As we proceed through 2016 and enter 2017, the strength of the stock market will be a key factor in the strength of the luxury market. If the stock market falters, look for high-end sales to slow. If the market advances, as it has shown signs of doing most recently, the high-end market will advance.

How To Get The Most Money When Selling Your House

Every homeowner wants to make sure they maximize their financial reward when selling their home. But how do you guarantee that you receive maximum value for your house? Here are two keys to ensuring you get the highest price possible.

1. Price it a LITTLE LOW

This may seem counterintuitive. However, let’s look at this concept for a moment. Many homeowners think that pricing their home a little OVER market value will leave them room for negotiation. In actuality, this just dramatically lessens the demand for your house (see chart below).

How To Get The Most Money When Selling Your House | Simplifying The Market

Instead of the seller trying to ‘win’ the negotiation with one buyer, they should price it so that demand for the home is maximized. In that way, the seller will not be fighting with a buyer over the price, but instead will have multiple buyers fighting with each other over the house.

Realtor.com, gives this advice:

“Aim to price your property at or just slightly below the going rate. Today’s buyers are highly informed, so if they sense they’re getting a deal, they’re likely to bid up a property that’s slightly underpriced, especially in areas with low inventory.”

2. Use a Real Estate Professional

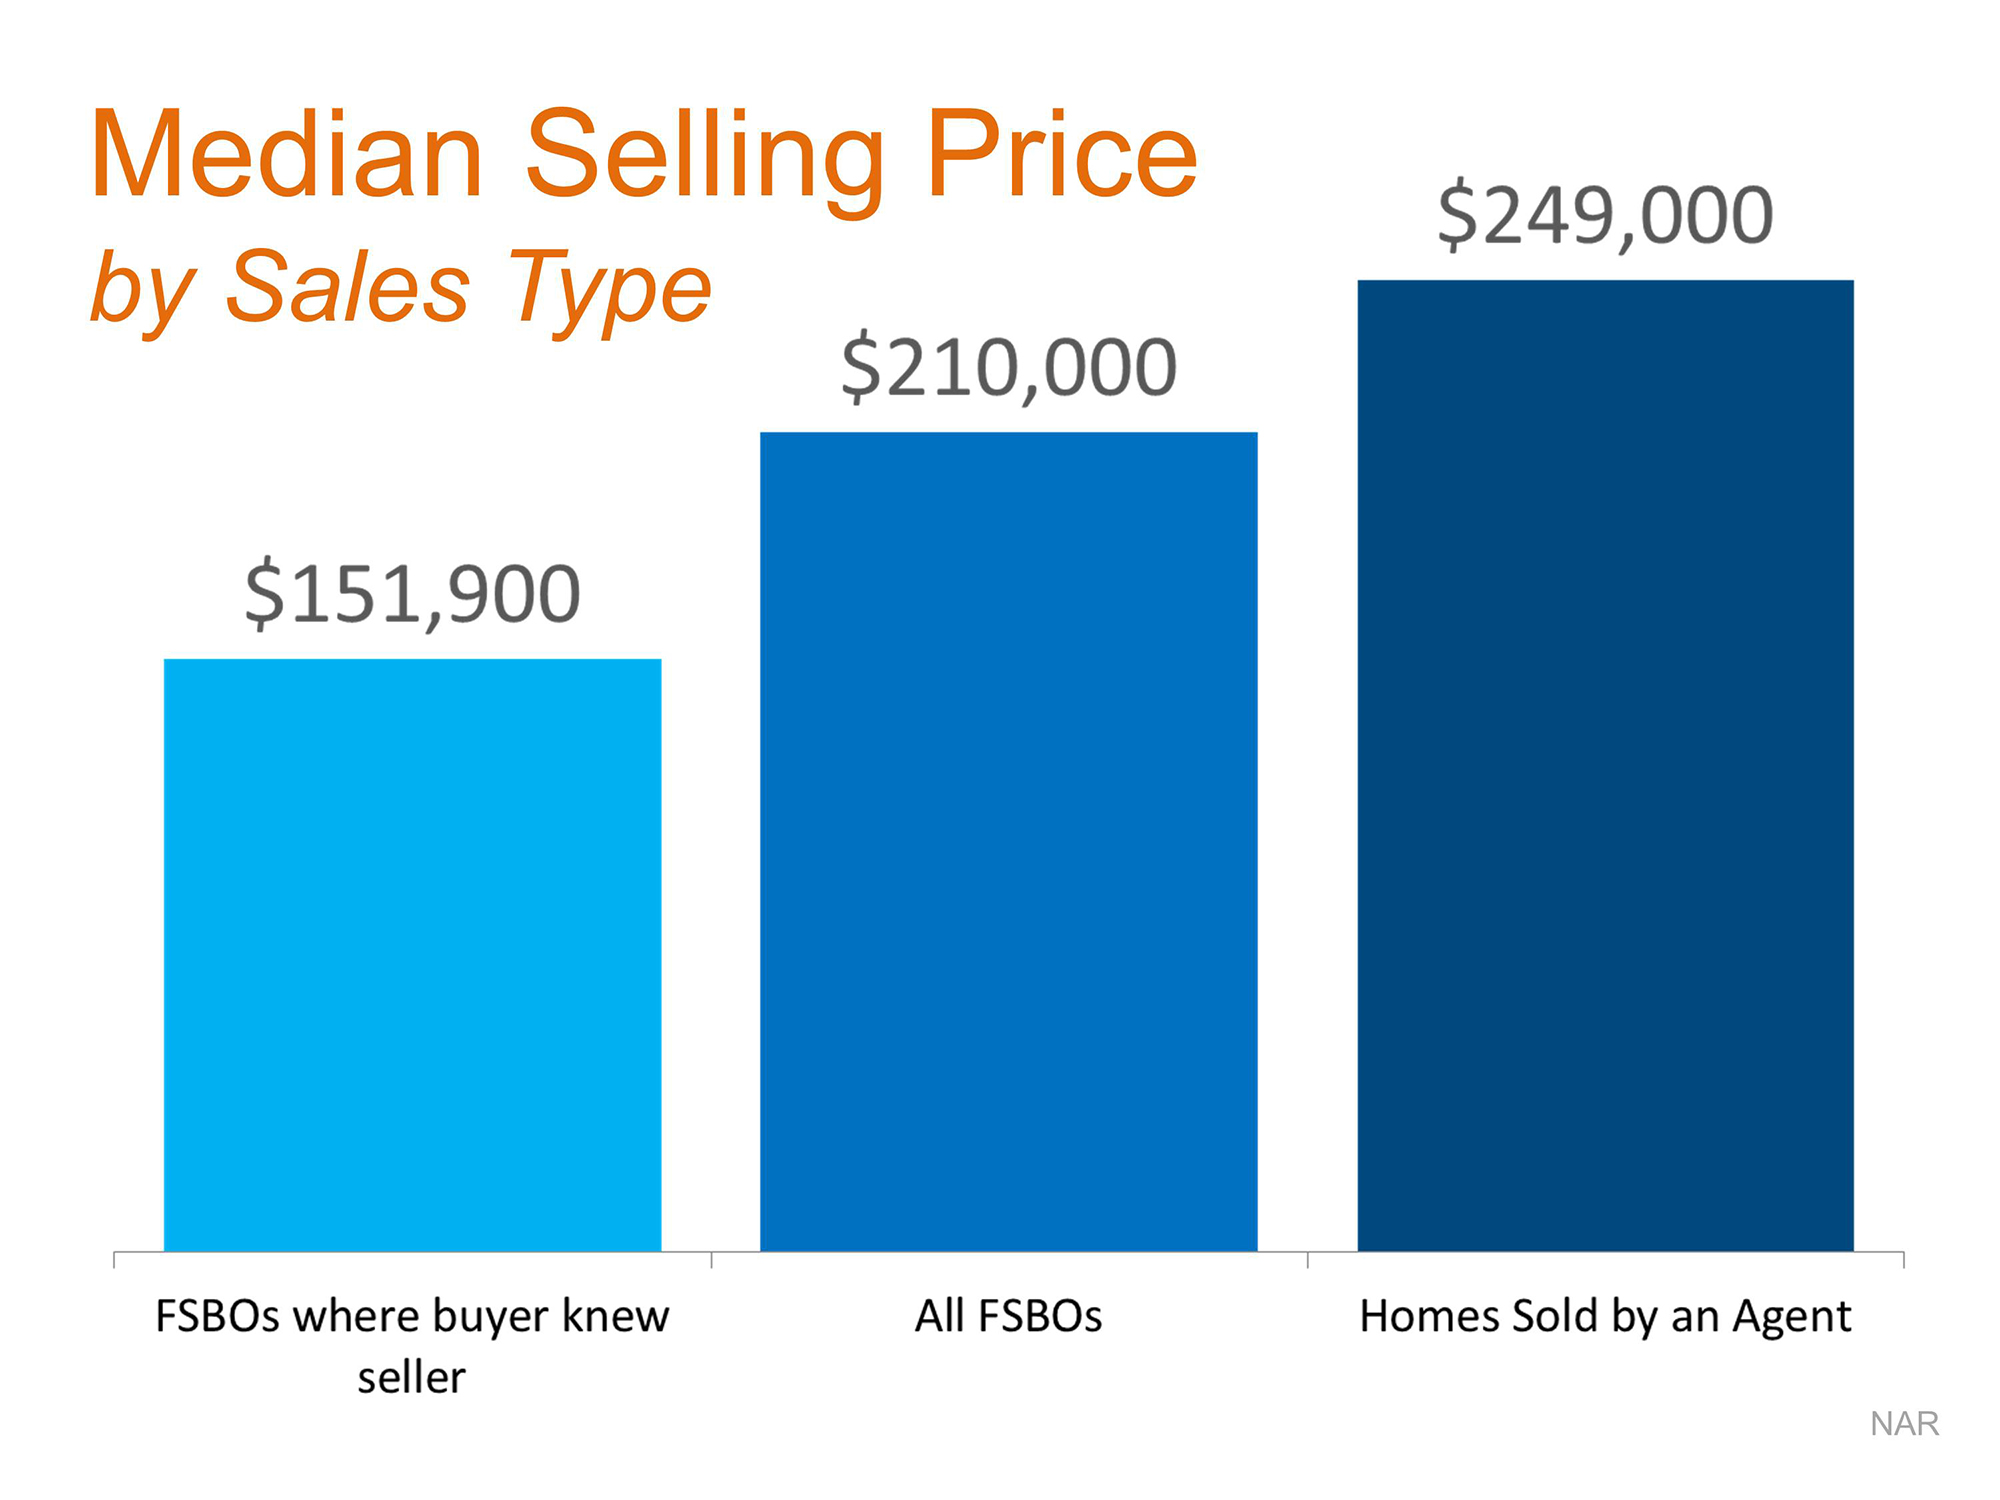
This too may seem counter intuitive. The seller may think they would net more money if they didn’t have to pay a real estate commission. With this being said, studies have shown that homes typically sell for more money when handled by a real estate professional.

Research posted by the Economists’ Outlook Blog revealed that:

“The median selling price for all FSBO homes was $210,000 last year. When the buyer knew the seller in FSBO sales, the number sinks to the median selling price of $151,900. However, homes that were sold with the assistance of an agent had a median selling price of $249,000 – nearly $40,000 more for the typical home sale.”

How To Get The Most Money When Selling Your House | Simplifying The Market

Bottom Line

Price your house at or slightly below the current market value and hire a professional. That will guarantee you maximize the price you get for your house.

Real Estate Values Today Compared to Pre-2008 Peak

This housing market has many people talking about home values; where they are and where they are headed. It’s also interesting to look back and see how home prices compare to values prior to the housing crisis.

Every quarter, Freddie Mac releases their House Price Index. The index usually provides monthly home values for:

  • the nation as a whole
  • each of the 50 states
  • 367 metropolitan statistical areas

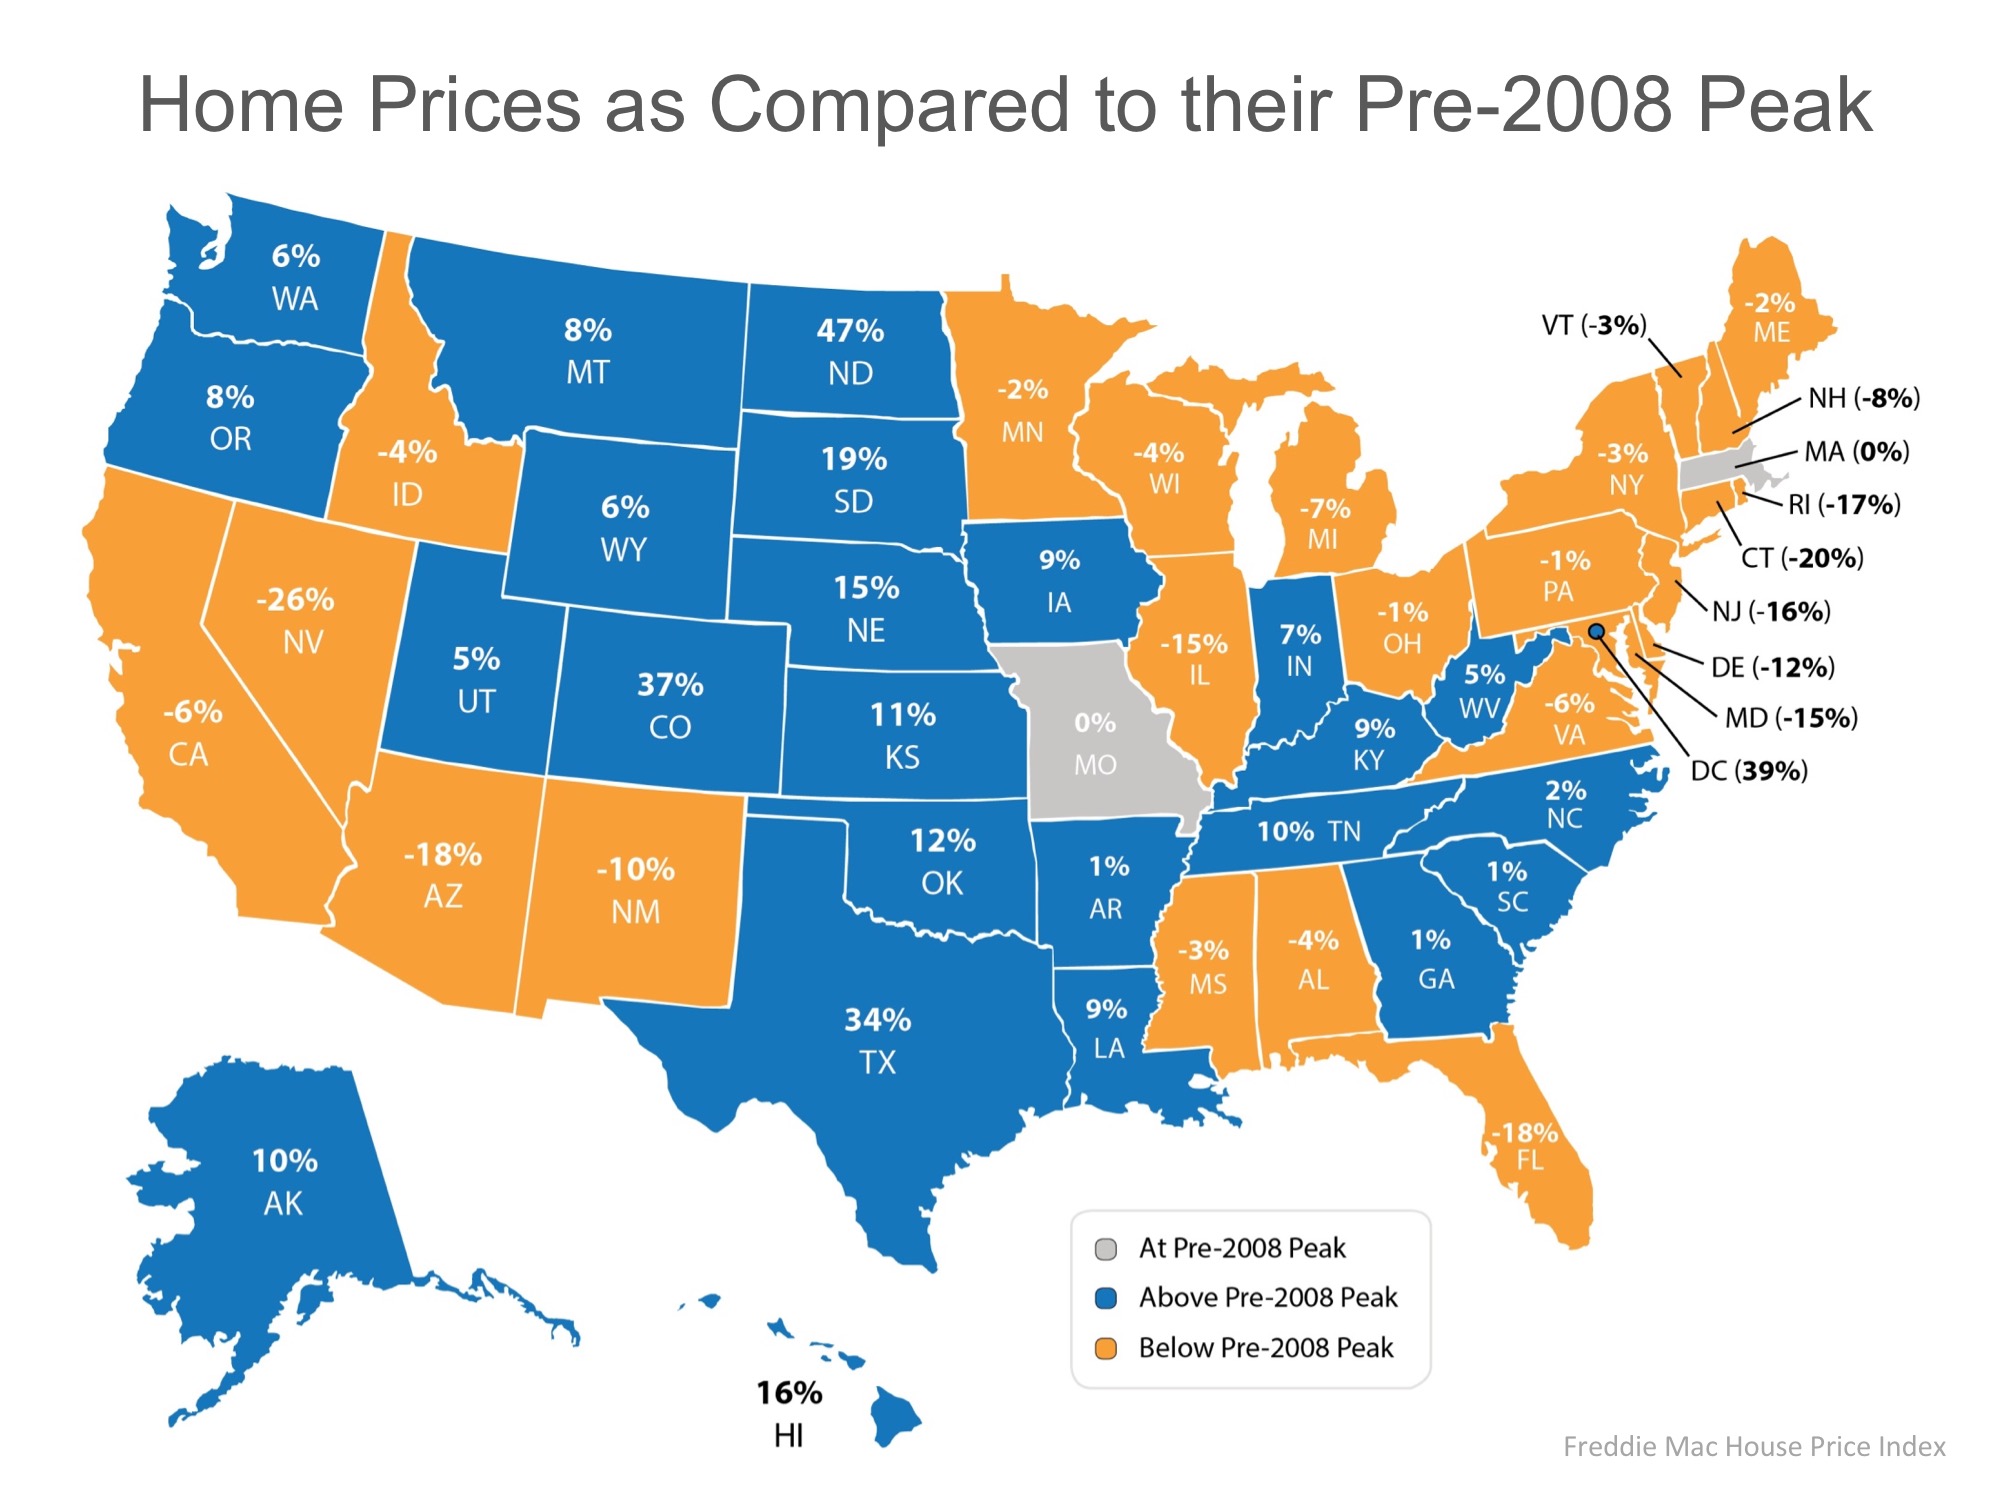
This quarter, the report also included a look at today’s home values as compared to Pre-2008 values. Here is a graphic that breaks down the numbers on a state-by-state basis:

Real Estate Values Today Compared to Pre-2008 Peak | Simplifying The Market