Ogden Valley Real Estate Outlook - October 2017

Ogden Valley Real Estate Market - Sobering Adjustments
The statistics and details below are a little deceiving as, for the most part, they show continued market improvement. What you can’t see is that in the last 6 weeks, there has been a considerable slow down (prices and days on market). This is starting to show with the 8% sold price decline below. It will be interesting to see if this trend over the last 6 weeks continues into the 4th quarter of 2017. All of the details are below.
For your free, no obligation equity analysis on your property, click here. We have buyers who can’t find the right Ogden Valley property - call Joel to see if what you have might be what they want.
See What Your Neighbor’s House Sold For: www.UtahSoldHomePrices.com
.
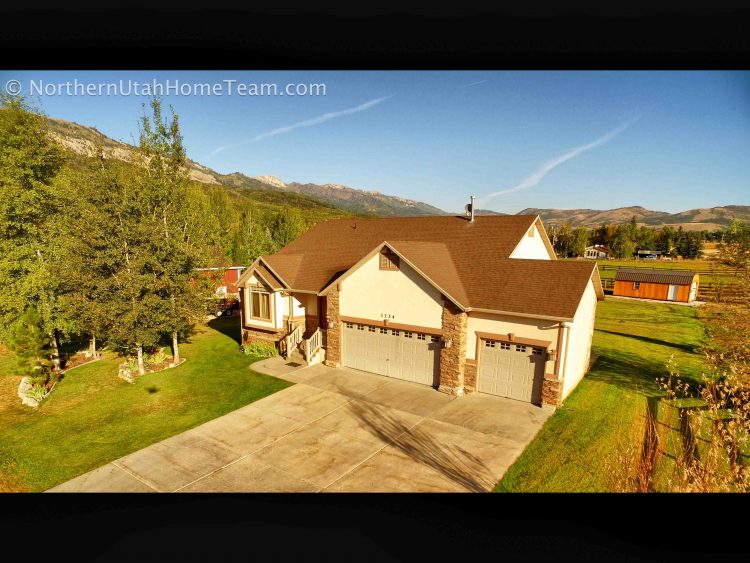
Featured Valley Listing: Click the photo for details, more photos, aerial video and walking tour video

| Single Family | 3rd Quarter 2017 | Change vs. 2nd Quarter 2017 | 3rd Quarter 2016 | Last 12 Months Change |
|---|---|---|---|---|
| Available Inventory | 88 (4.7 mos) | -8% | 111 (5.1 mos) | -21% |
| Sold | 35 | 9% | 38 | -3% |
| Avg.Days on Market | 86 | -17% | 65 | -9% |
| Median Sold Price | $448,200 | -8% | $417,500 | 8% |
To learn how our Ultimate 57-Point Marketing Plan is earning our sellers about 4% more and selling in ½ the time (compared to the average agent), click here or just give us a call.
This report is developed quarterly and is based on information from Wasatch Front Regional MLS for the period stated above.
